Cases
Overview
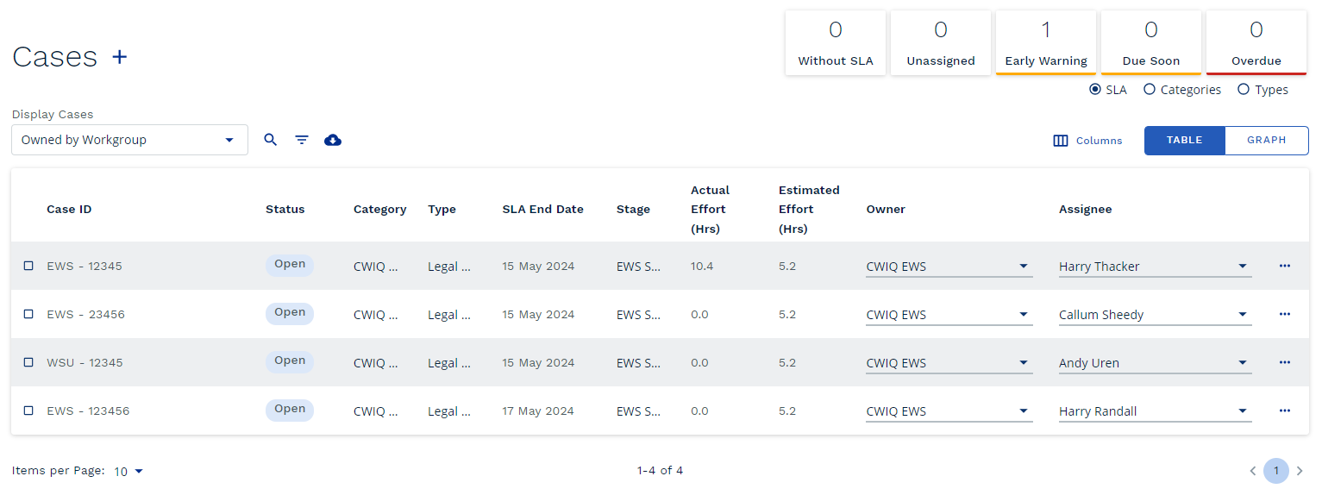
The Cases Screen in ControliQ allows you to create, edit and view details about cases. Here you can update key information about current cases such as Stage, Status, Category and Type and Owner as well as view those cases that are approaching their due date or could be at risk of missing SLA.
|
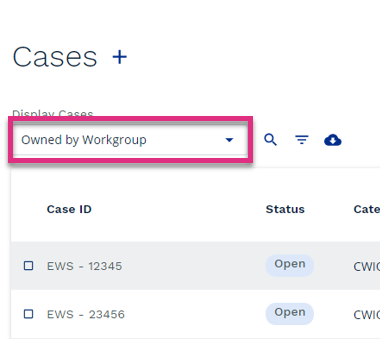
You can refine the list of Cases displayed in table view using the Display Cases drop-down menu, search function and filters.
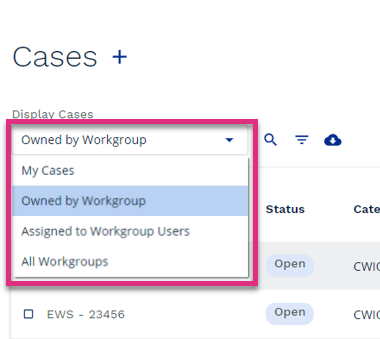
The Display Cases drop-down menu allows you to refine the cases based on Ownership:
|
-
My Cases – View only the Cases that are assigned to you.
-
Owned by Workgroup – View only cases that are assigned to the workgroup you currently have selected in the hierarchy selector.
-
Assigned to Workgroup Users – View only Cases assigned to users that sit within the level of the hierarchy you currently have selected in the hierarchy selector.
-
All Workgroups – View Cases owned by any workgroup that you have permissions to access.
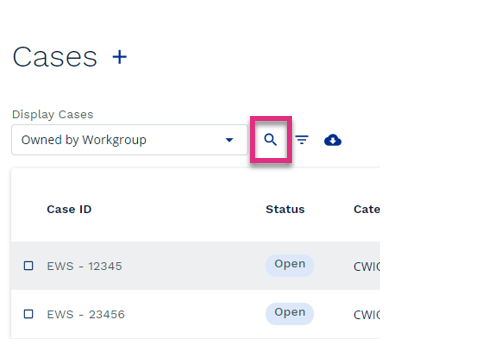
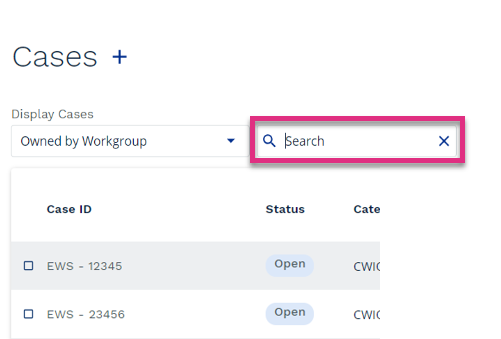
You can also refine the cases using the Search function. Selecting the ![]() icon will open the Search box where you can enter specific case id’s or partial case id’s.
icon will open the Search box where you can enter specific case id’s or partial case id’s.
|
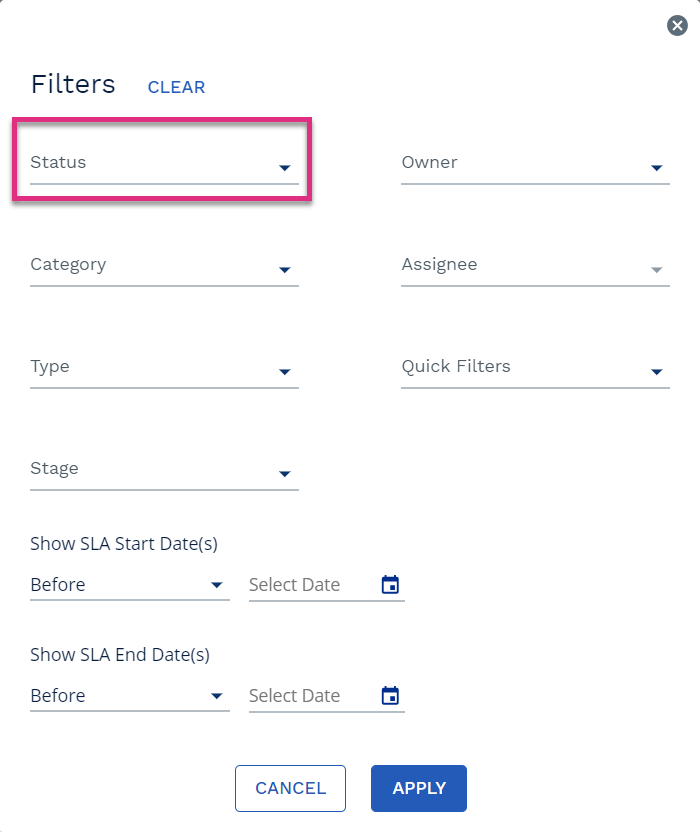
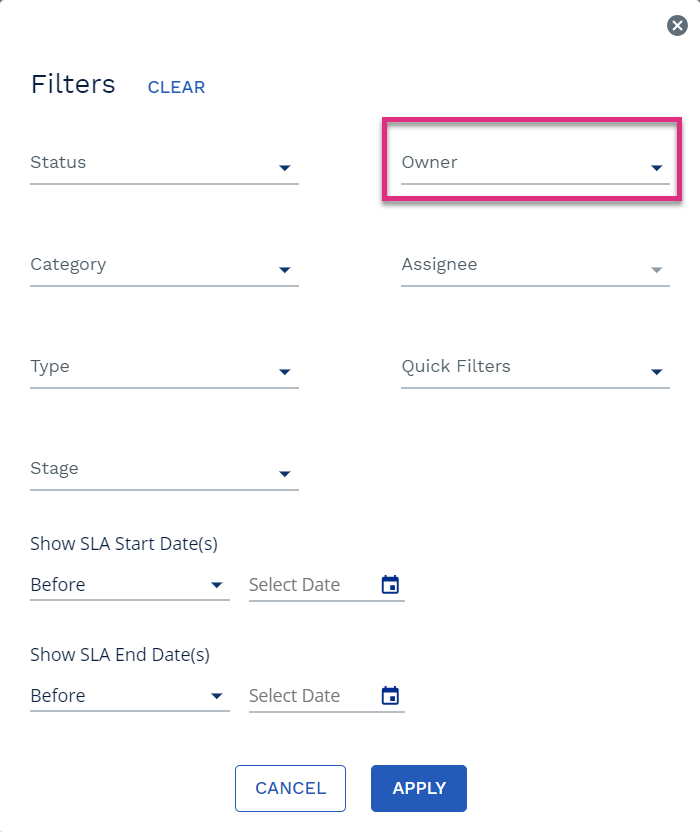
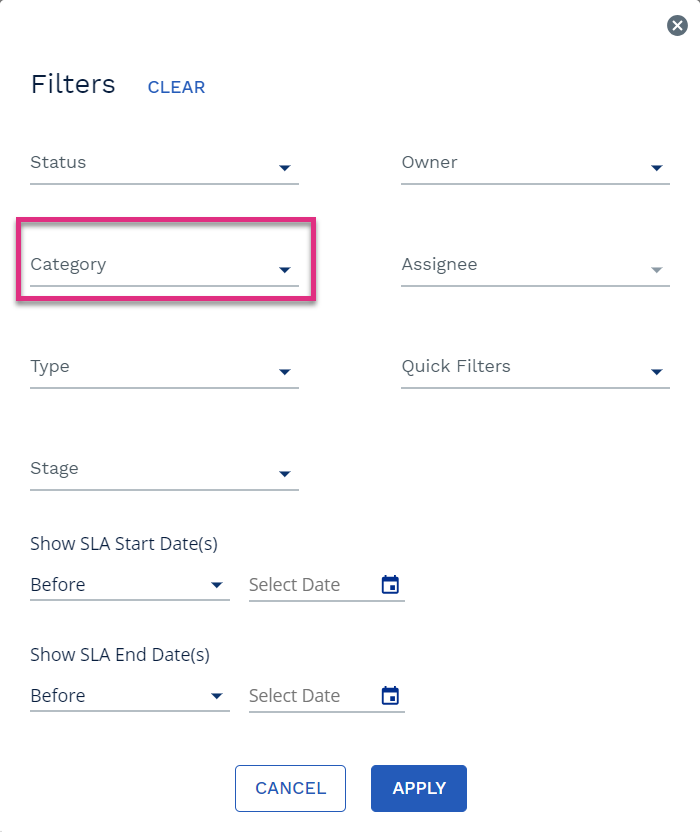
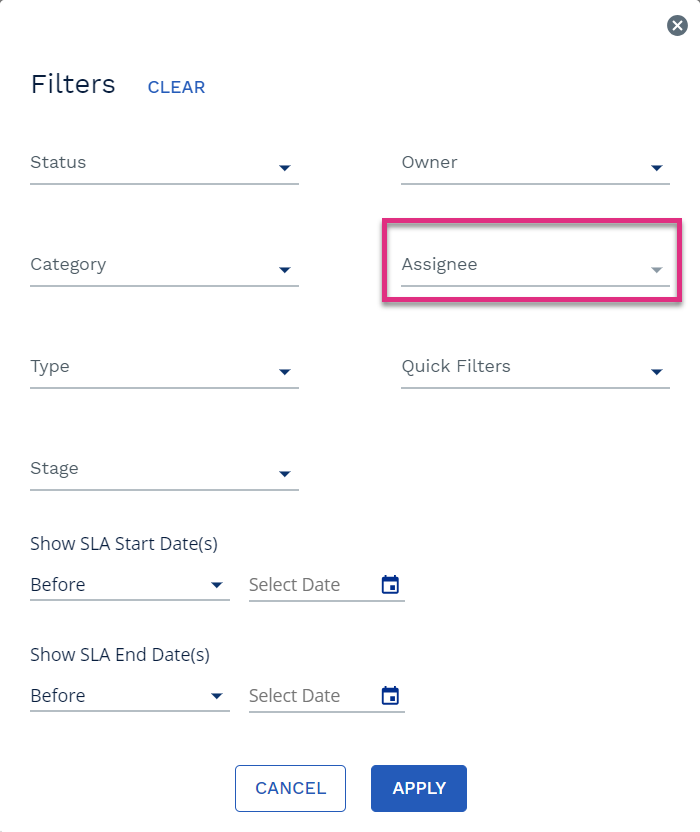
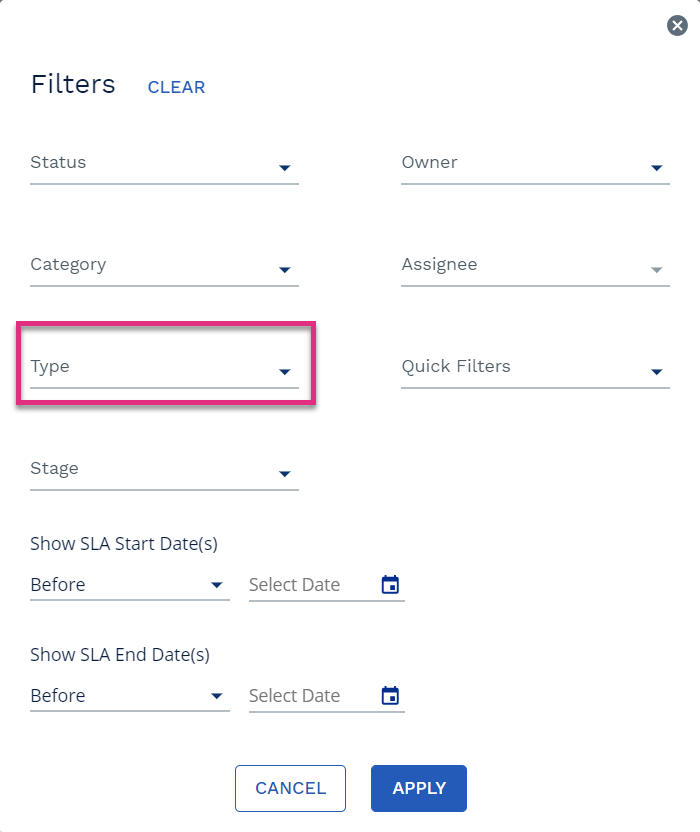
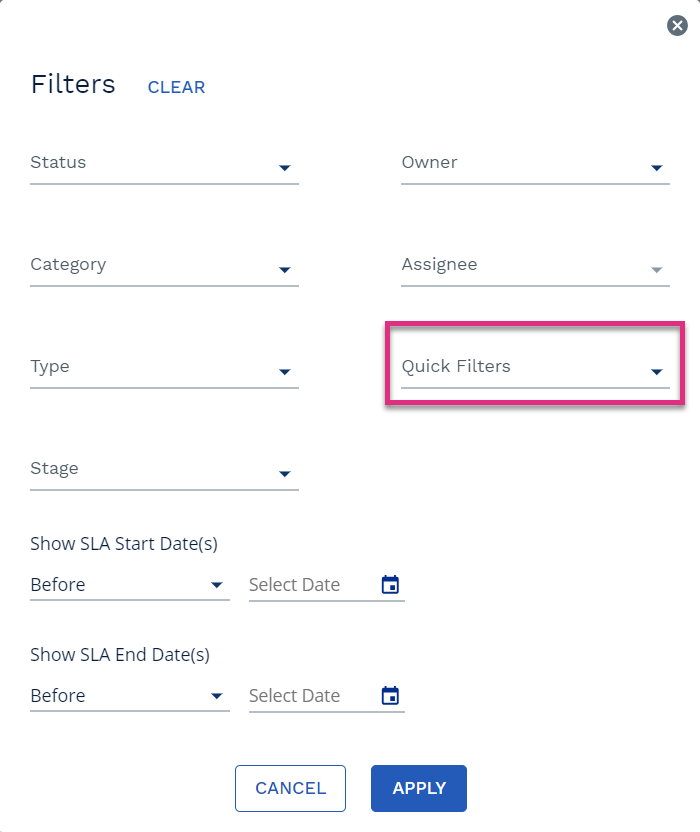
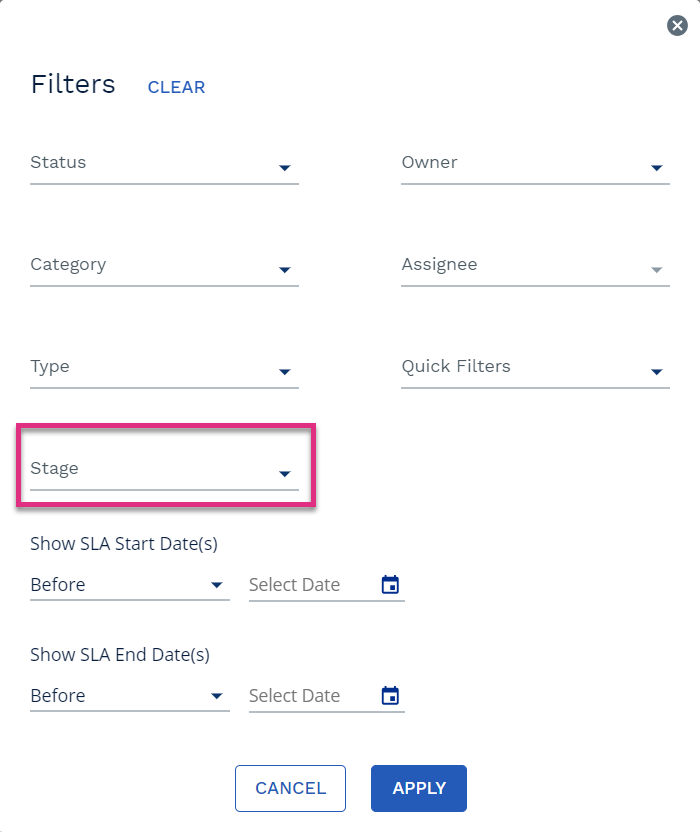
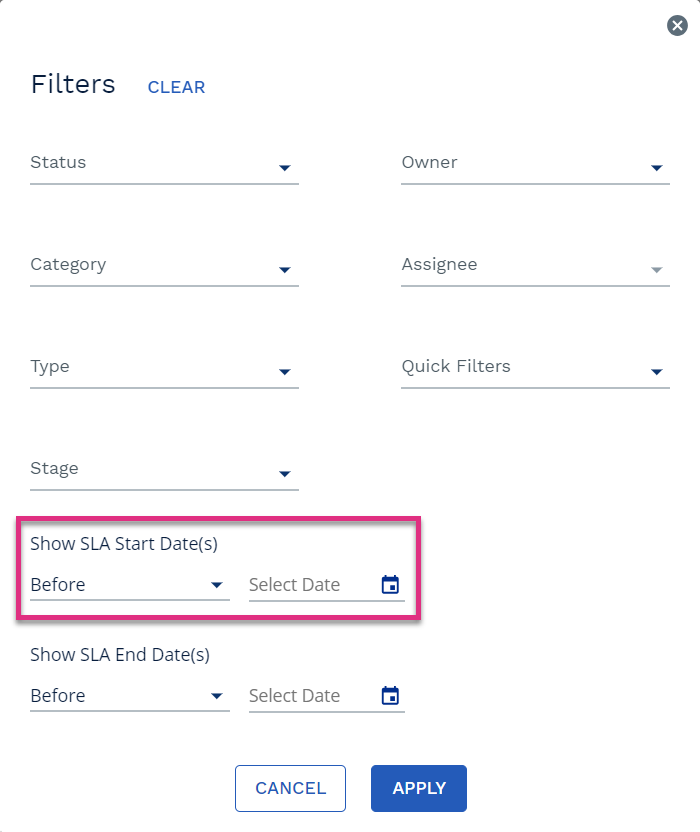
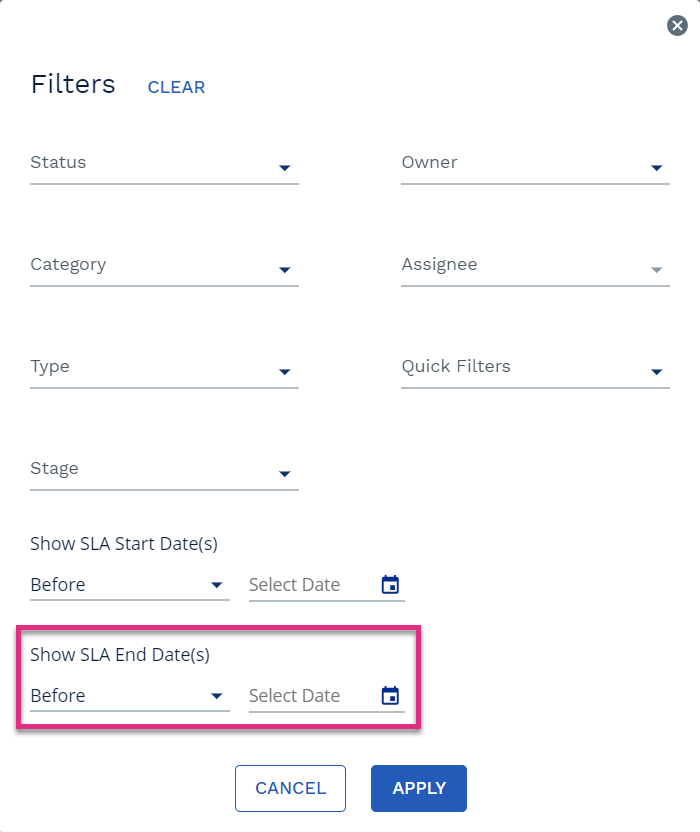
Selecting the ![]() icon allows you to refine the cases displayed in table view by key case attributes. Clicking the icon prompts the filters dialogue box to open where you can choose to refine the cases displayed by one or more key attributes.
icon allows you to refine the cases displayed in table view by key case attributes. Clicking the icon prompts the filters dialogue box to open where you can choose to refine the cases displayed by one or more key attributes.
|
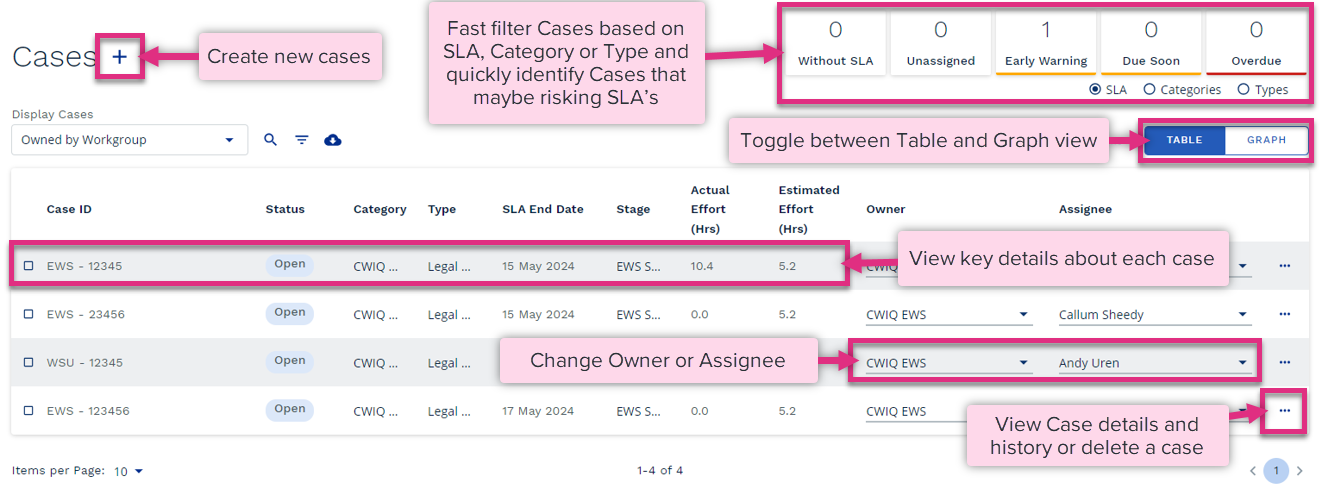
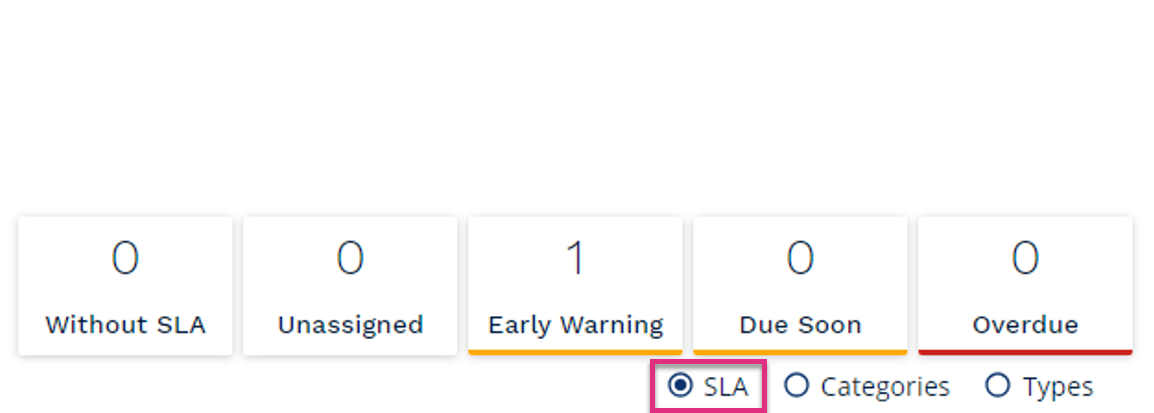
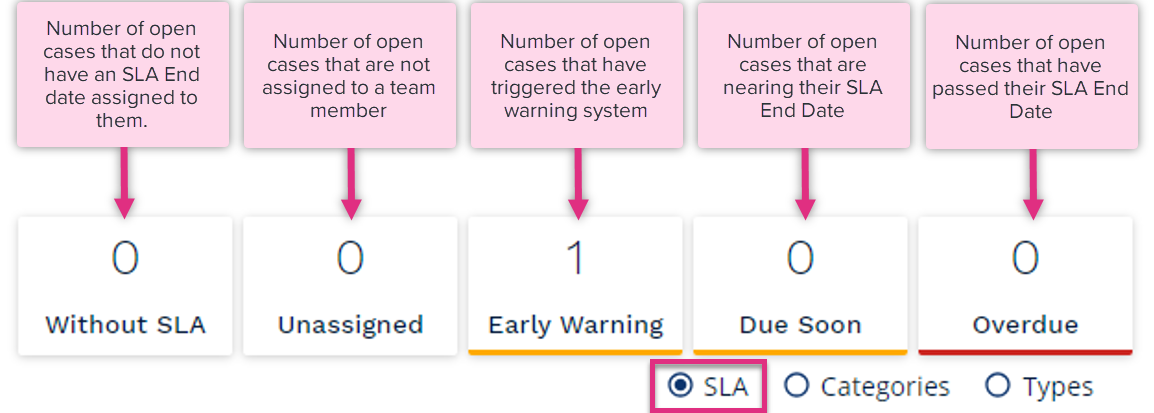
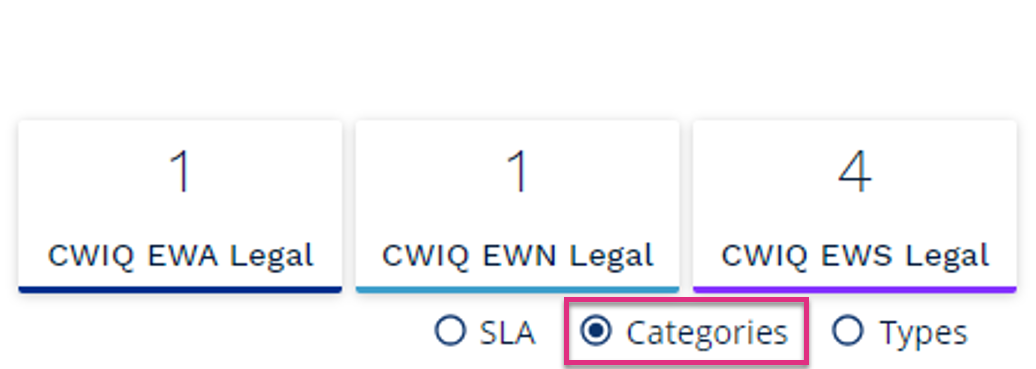
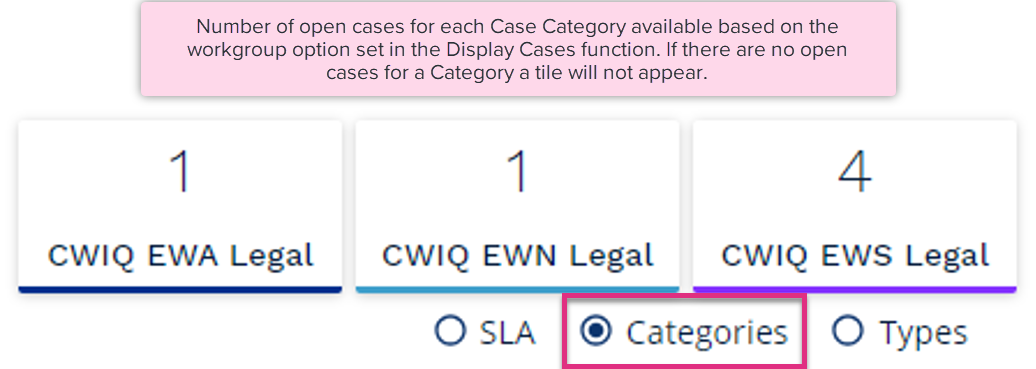
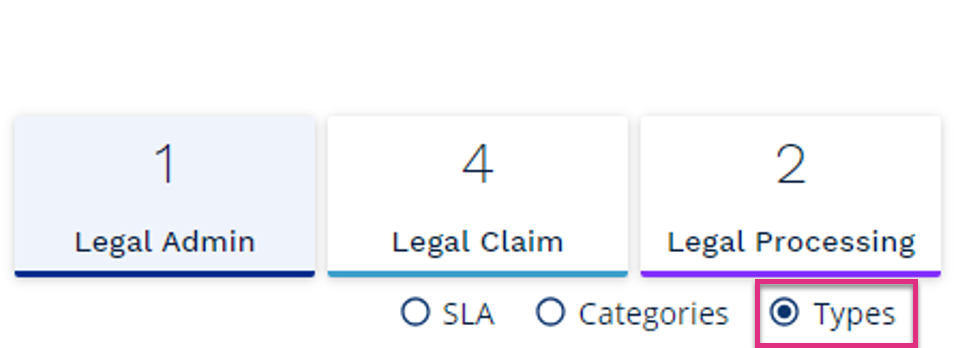
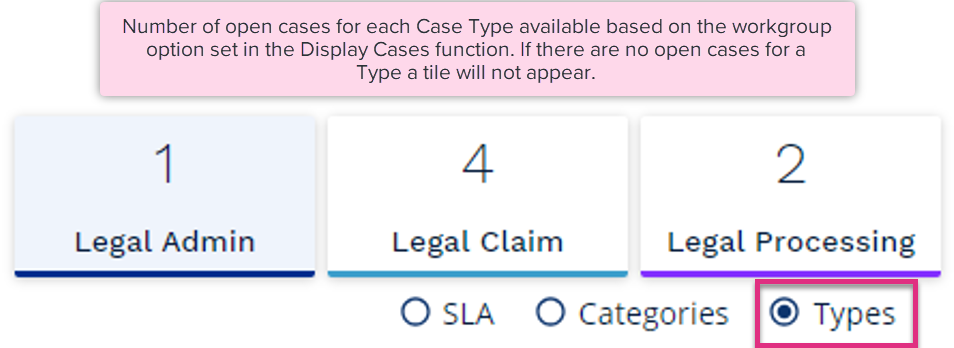
The fast filter tiles at the top of the Cases screen provide a quick overview of all your current open cases but allow you to filter the cases displayed in the cases table quickly based on the tile attributes. These attributes are based on SLA, Category or Type
Clicking on the tiles will filter the cases shown in the cases table.
|
|
|
Once you have refined the list of cases displayed in the Cases table you can export this information to MS Excel using the ![]() icon.
icon.
The export will display the key information viewable in the cases table for all the cases displayed as well as the Case Description if one has been added.

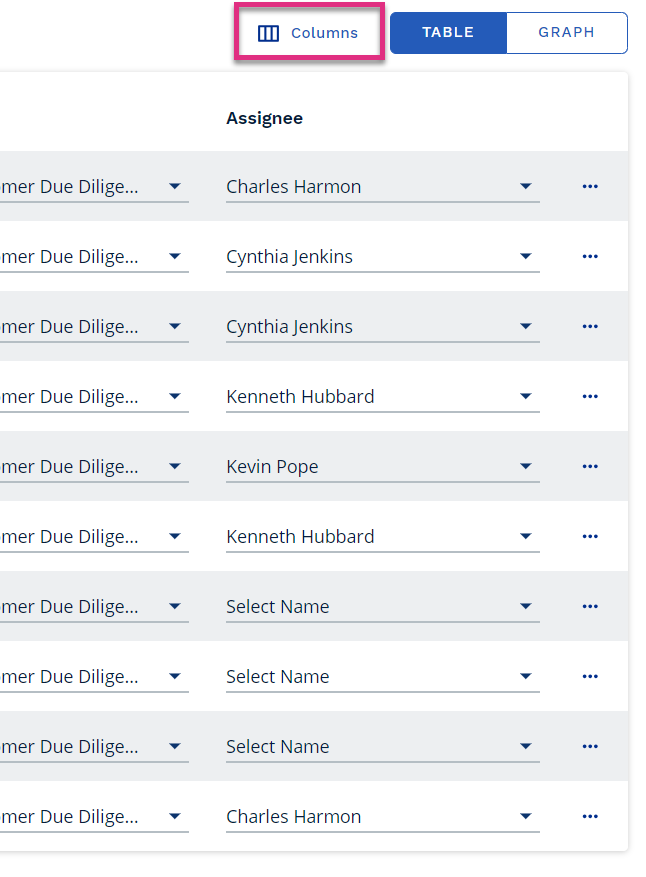
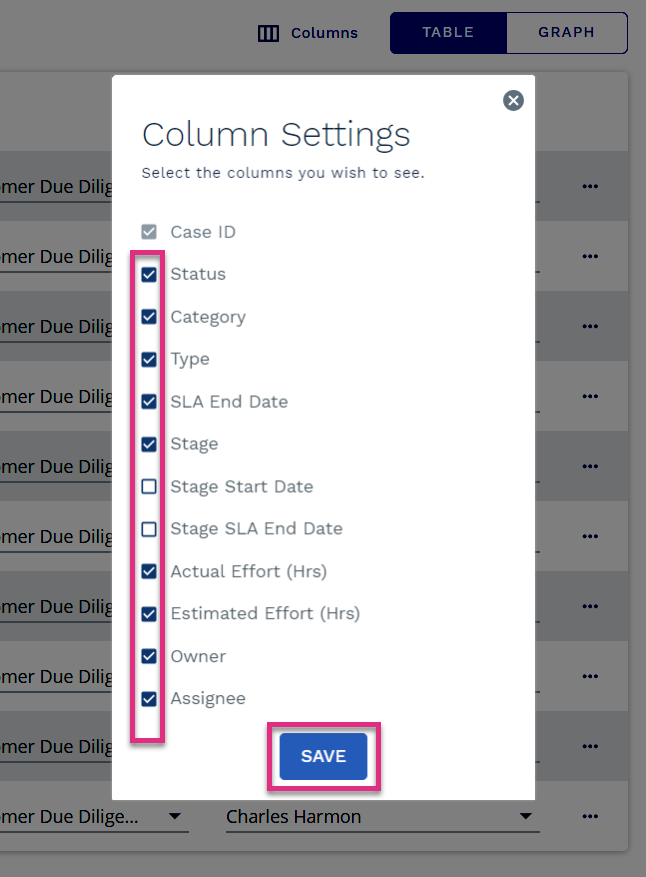
You can further refine the information displayed for cases in the cases table using the Columns function. Click the  icon to select the data you would like to view in the table.
You can add or remove columns by selecting the or de-selecting the checkbox next to the column header. Once saved these changes will apply to your view of the cases table until you amend them.
|
The cases table provides you with an overview of cases that meet the criteria you have set to display cases. By default, the table will display open cases. From this table you can review the cases current position, amend the owner and assignee, and allows access the case details and history.
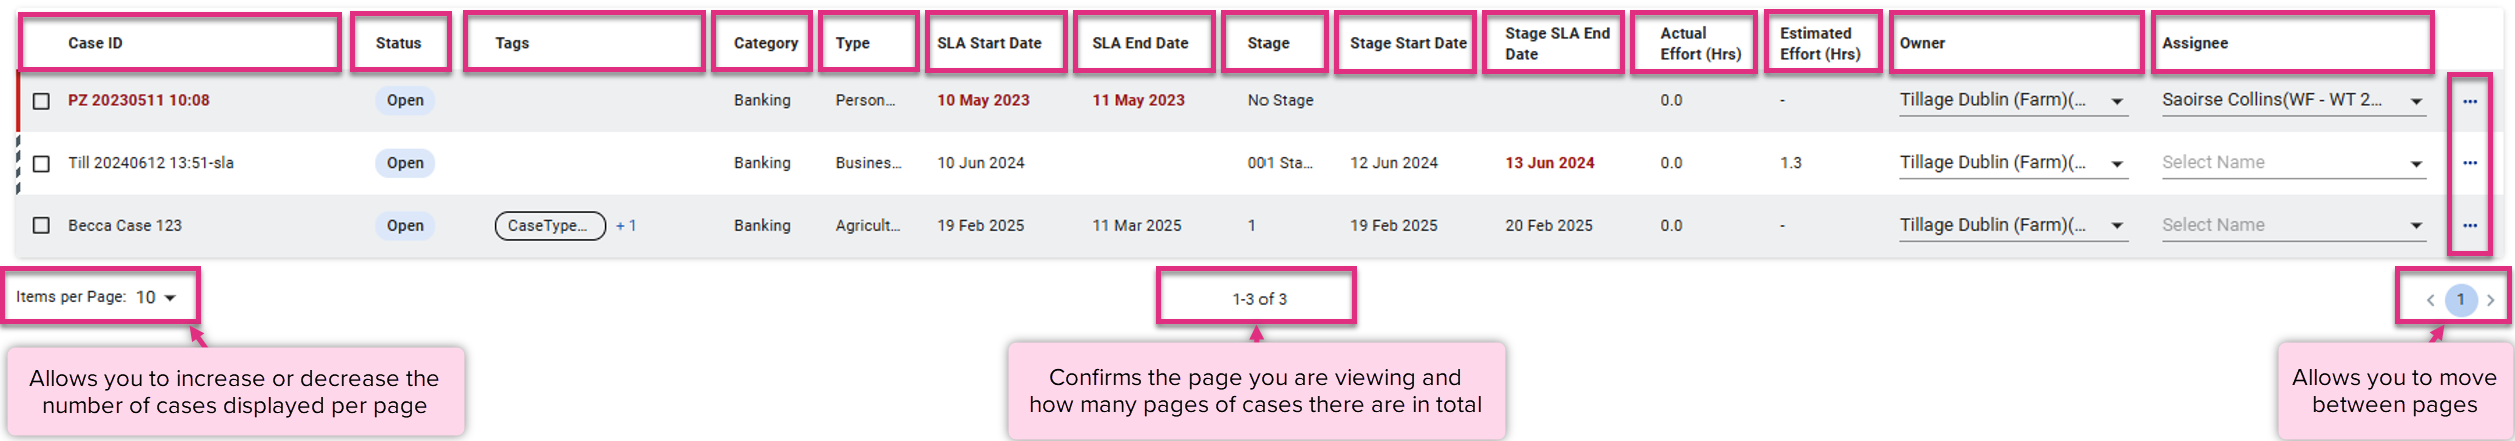
Case ID
Status
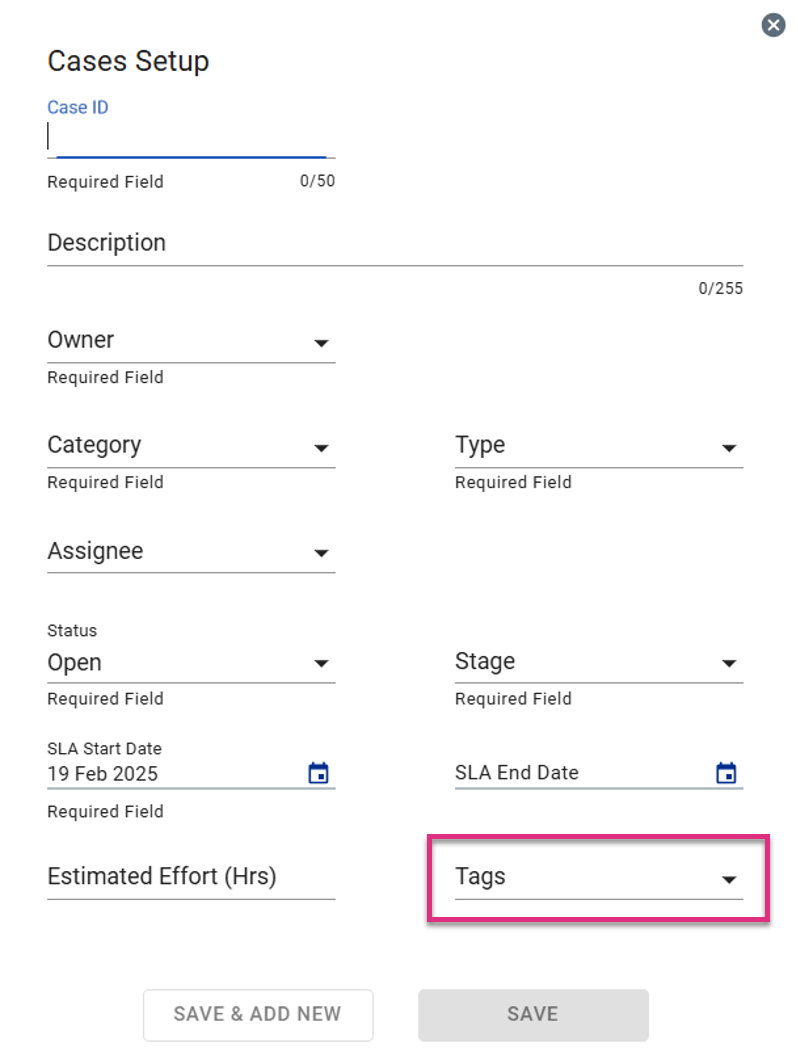
Tags
Category
Type
SLA End Date
Stage
Stage Start Date
Stage SLA End Date
Actual Effort (Hrs)
Estimated Effort (Hrs)
Owner
Assignee
|

|
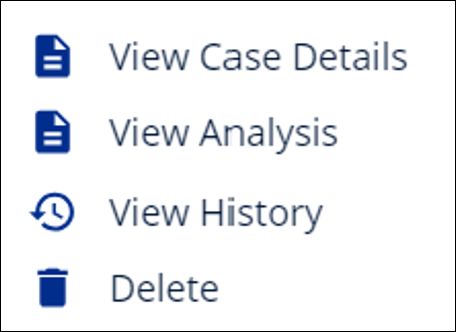
Click on the ellipse button to access the Case Details and History page or delete a case
|
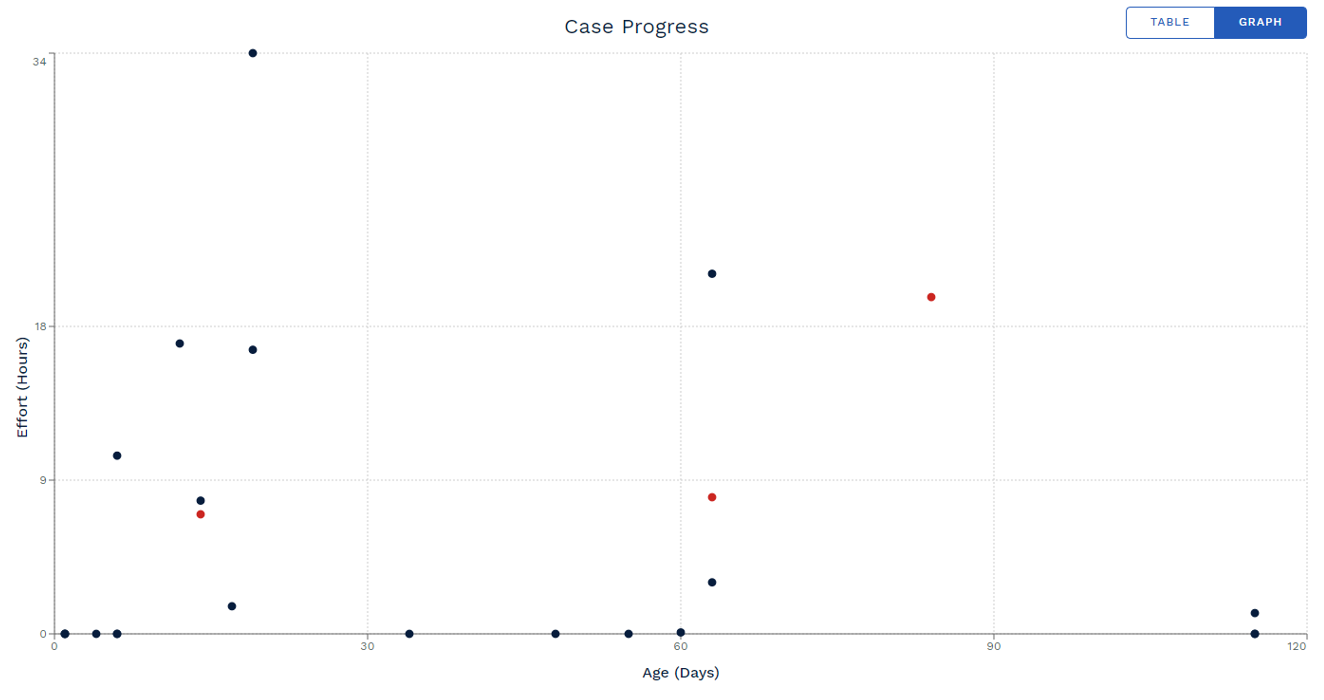
You can change the way cases are viewed from table to graph using the  toggle. The Graph view provides a view of your cases presented in a scatter chart. You can use the Case Display and filtering options to refine the cases that appear in the graph.
|
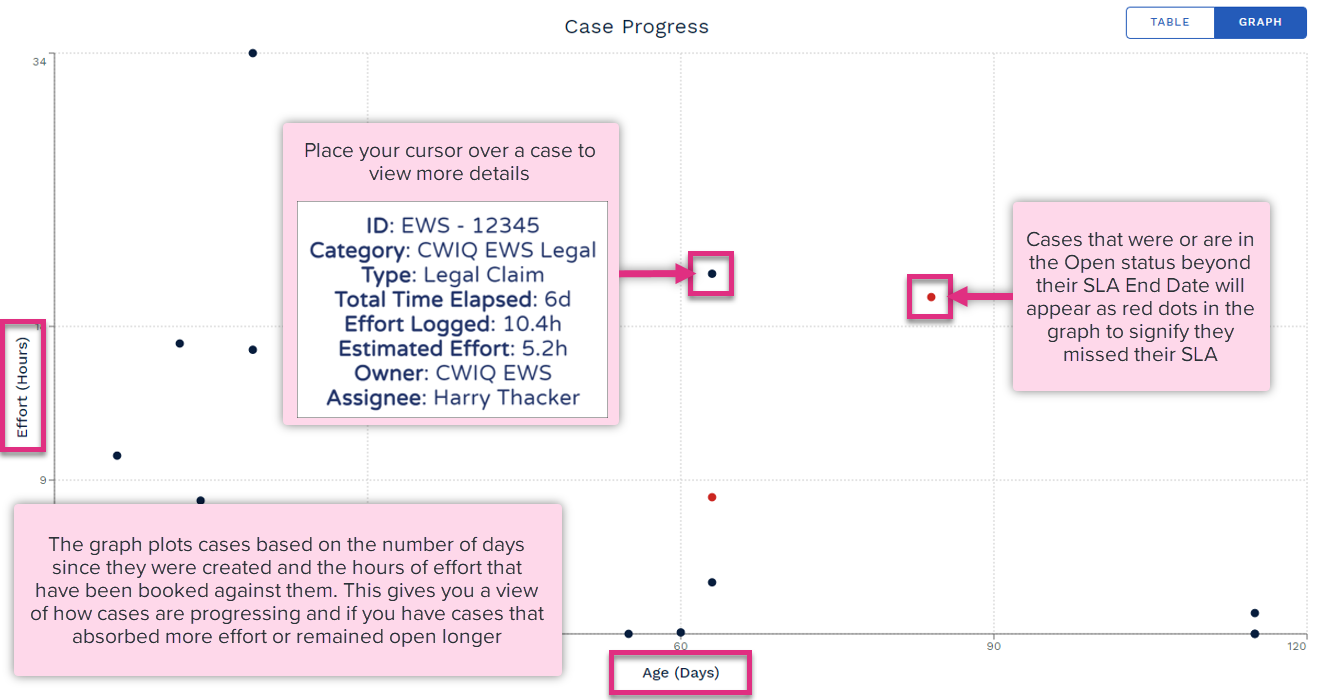
Clicking on the dot for a case within the Graph view will open the Case History and Details view for that case.
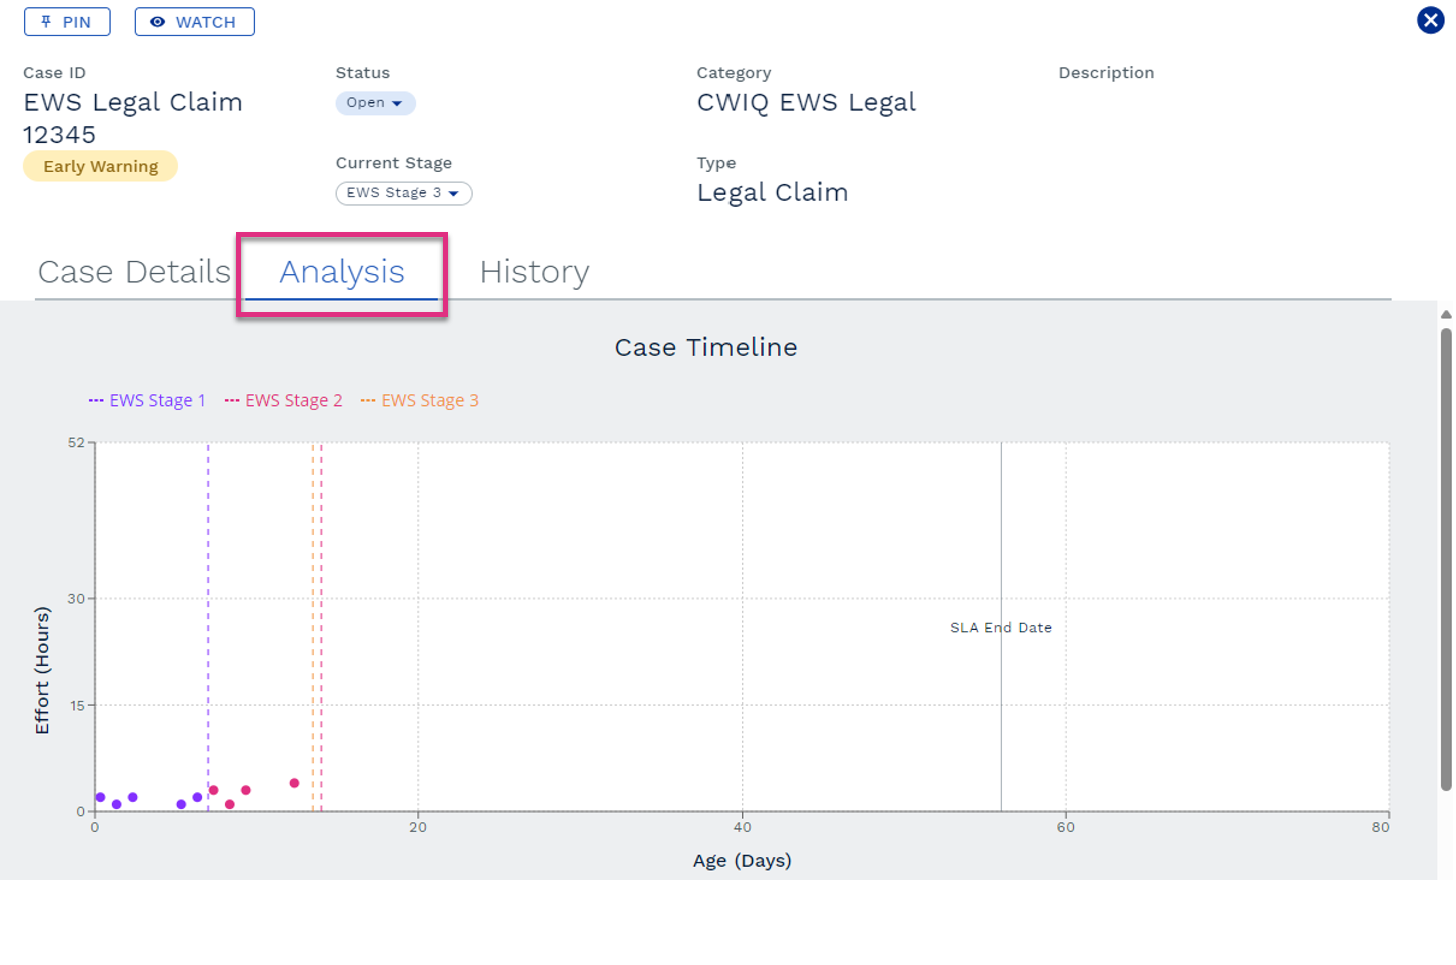
The Case Details, Analysis and History view allows you to see the progress a case has made in relation to age and hours of effort booked to it as well as an audit of the individual touch points within that cases journey.
You can access the Case Details, Analysis and History screens from the Cases menu by selecting the dot that represents that case when in Graph view or clicking on the icon when in the table view.
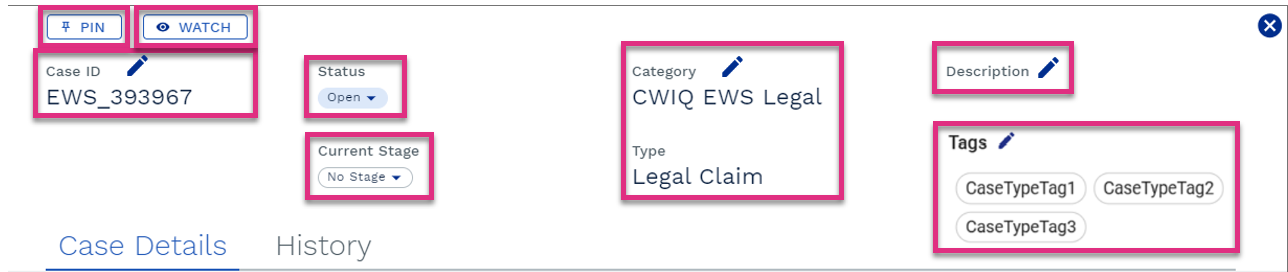
Pin
Watch
Case ID
Status
Current Stage
Category and Type
Description
Tags
|
|
Please Note! Changing the Case ID will change the ID for historical and future data. The date, time, change made and user that made the change will be visible in the Case History tab of this screen. Changing the Case Category or Type will:
|
The Case Details screen allows you to view and edit key case attributes as well as view the progress that has been made on the case to date compared to the estimated case trajectory.
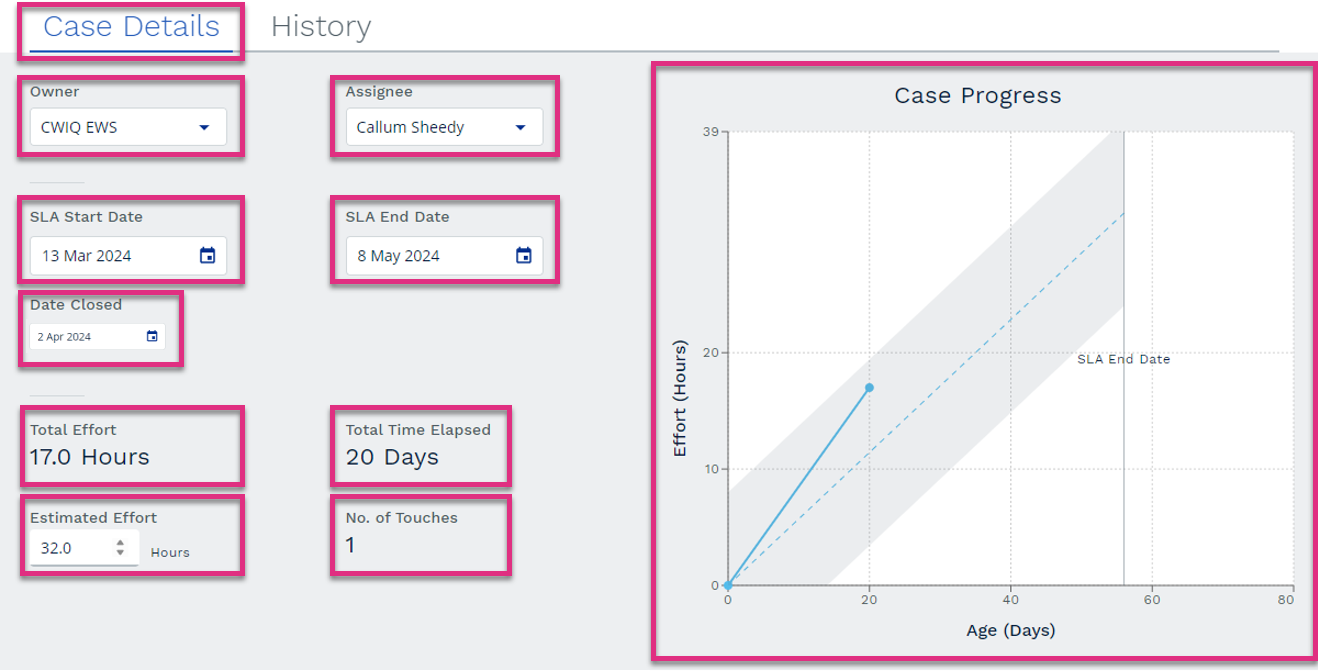
Owner
Assignee
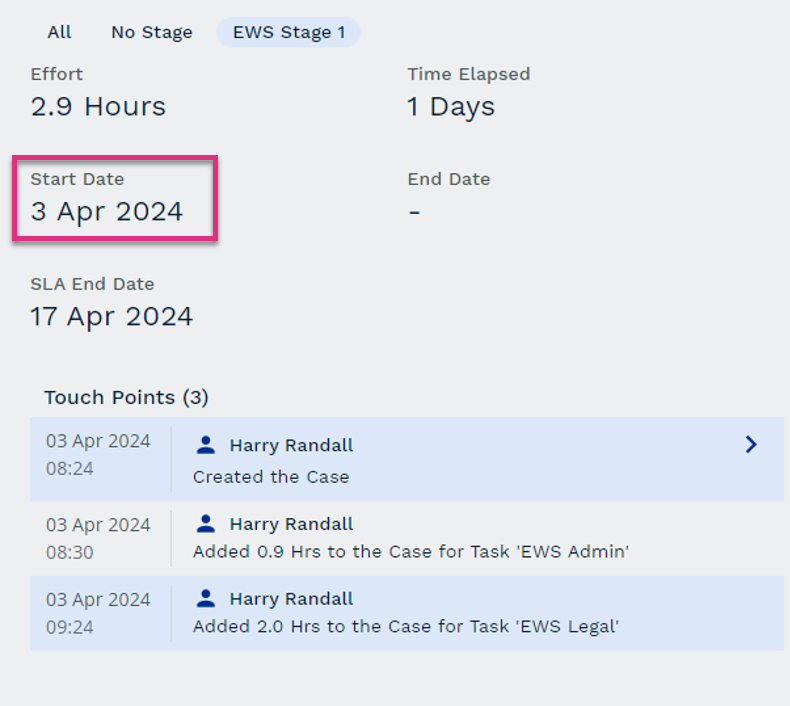
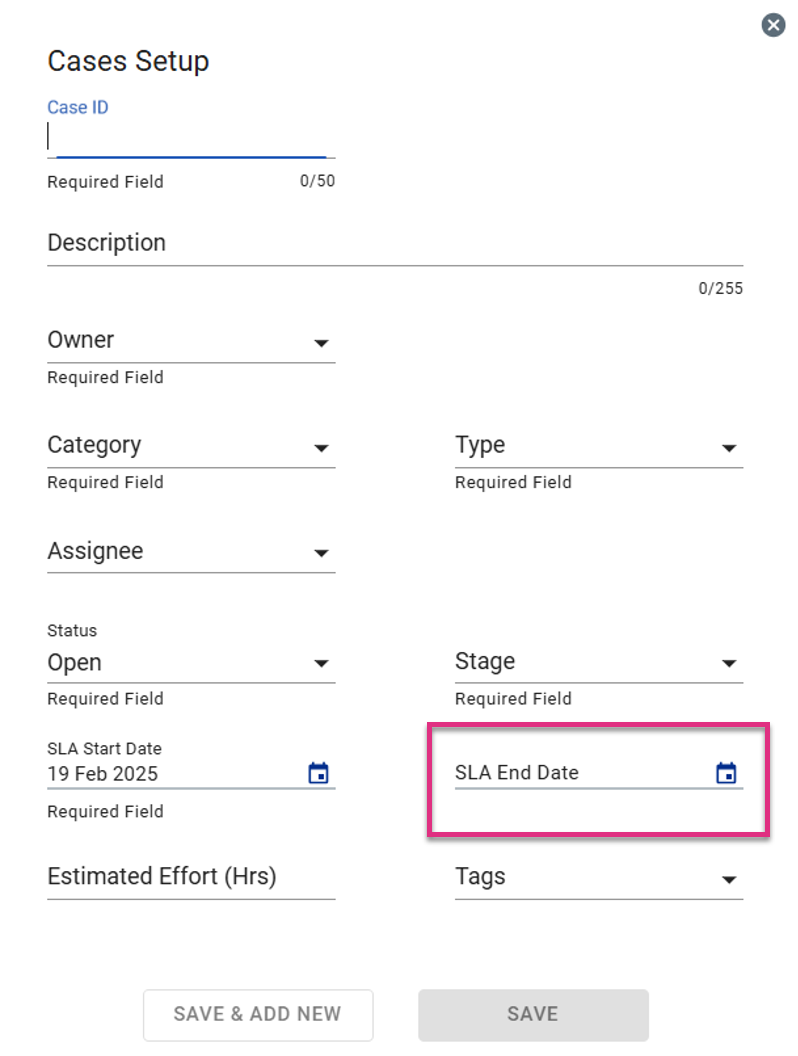
SLA Start Date
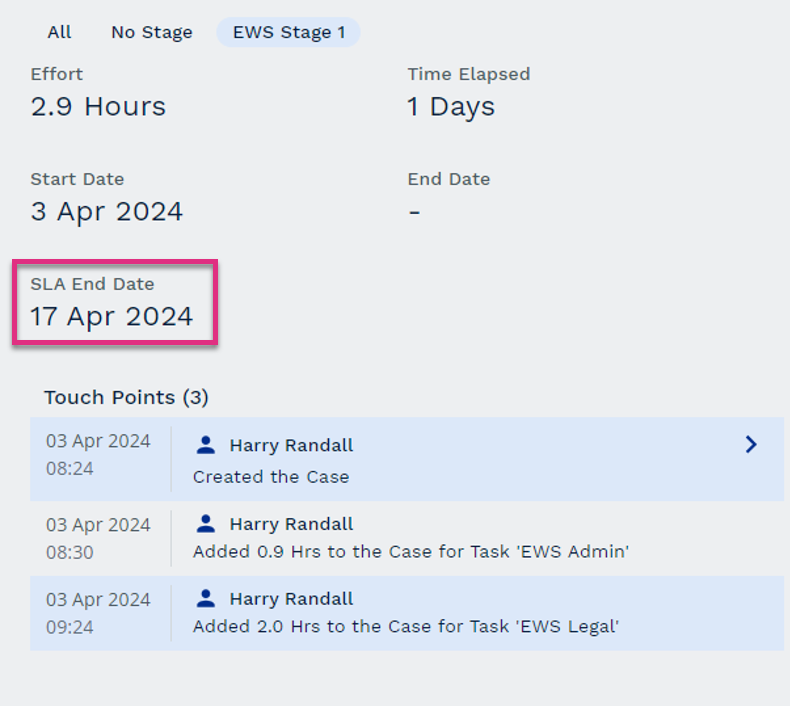
SLA End Date
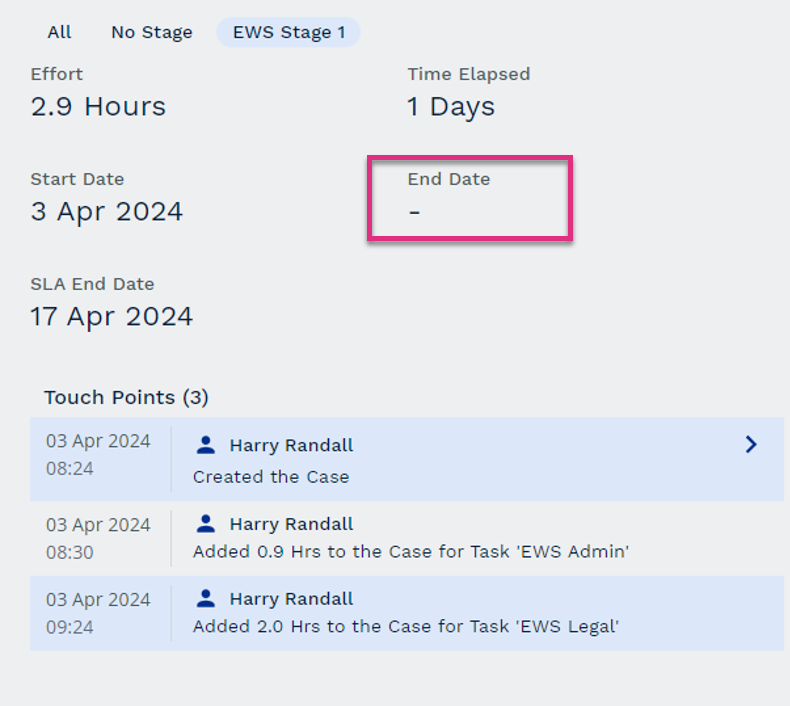
Date Closed
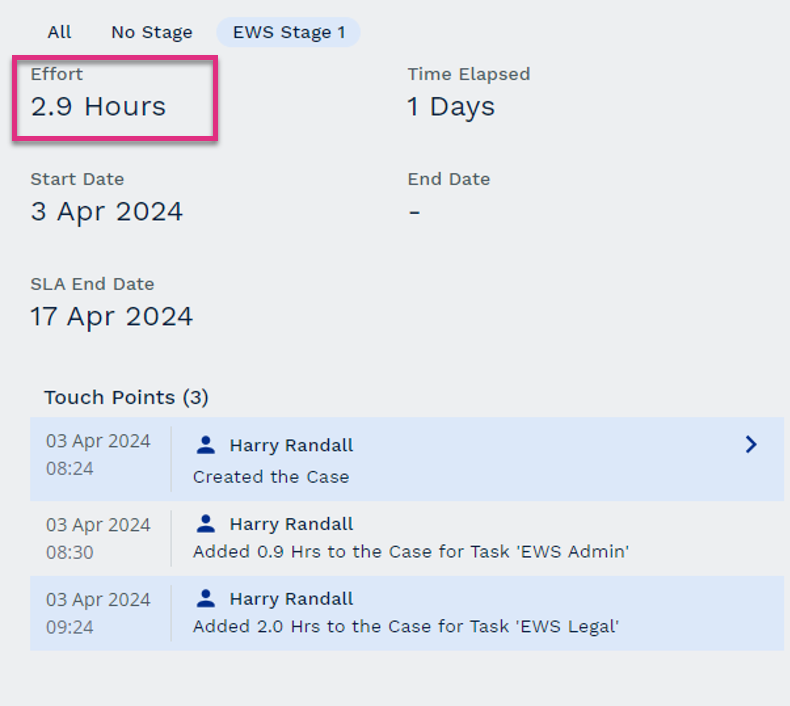
Total Effort
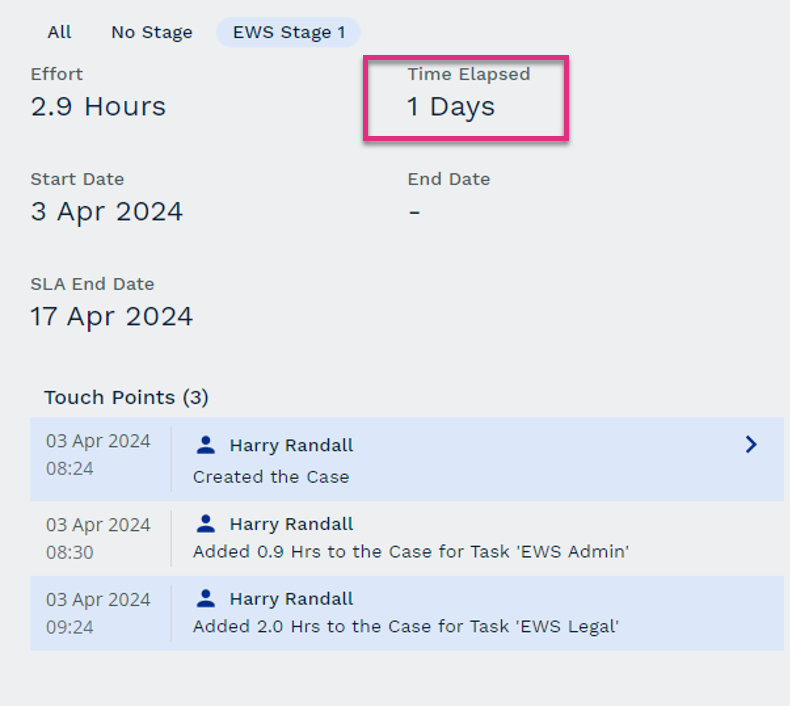
Total Time Elapsed
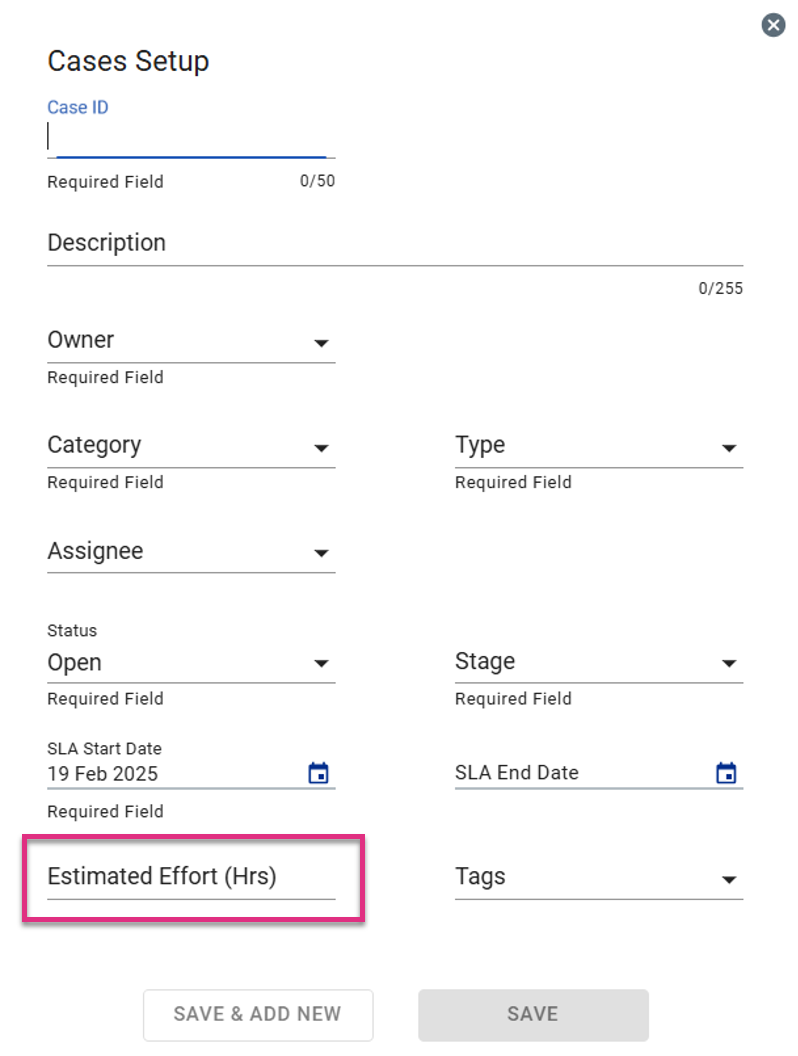
Estimated Effort
No. of Touches
Case Progress
|
|||||||||||
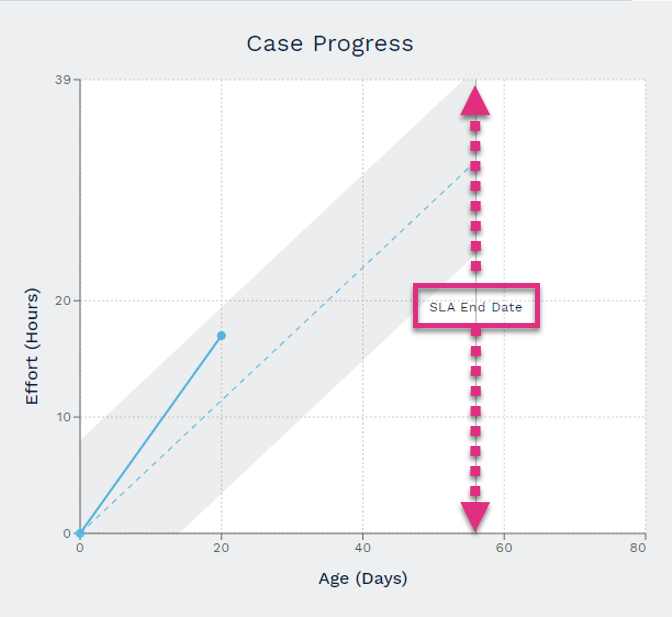
 The dashed blue line illustrates the expected trajectory based on expected hours of effort required to close the case and the number of SLA days to reach closure. The estimated effort can be based on the average effort required to close cases of the same Type historically or a value that is manually entered when the case is created. The SLA end date will either be based on the SLA linked to the case Type or manually entered when the case is created.
 The solid blue line illustrates the total actual effort captured against the case in the days it has been open. This allows you to see how this case is tracking compared to the expected trajectory.
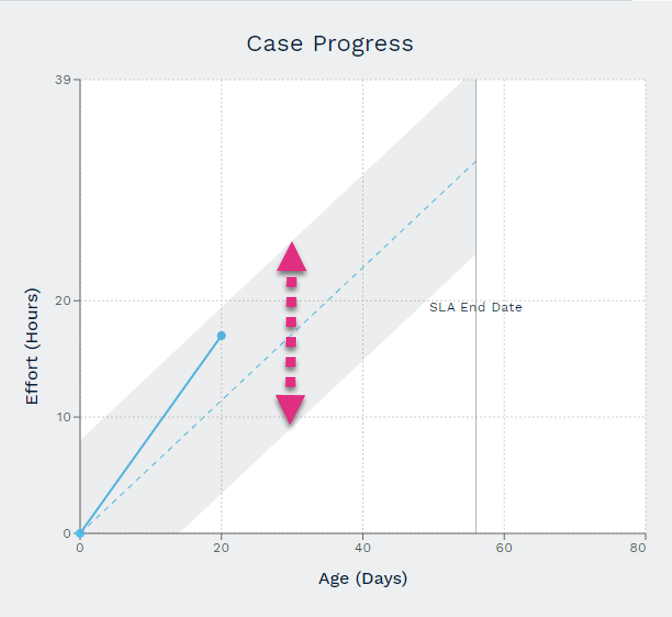
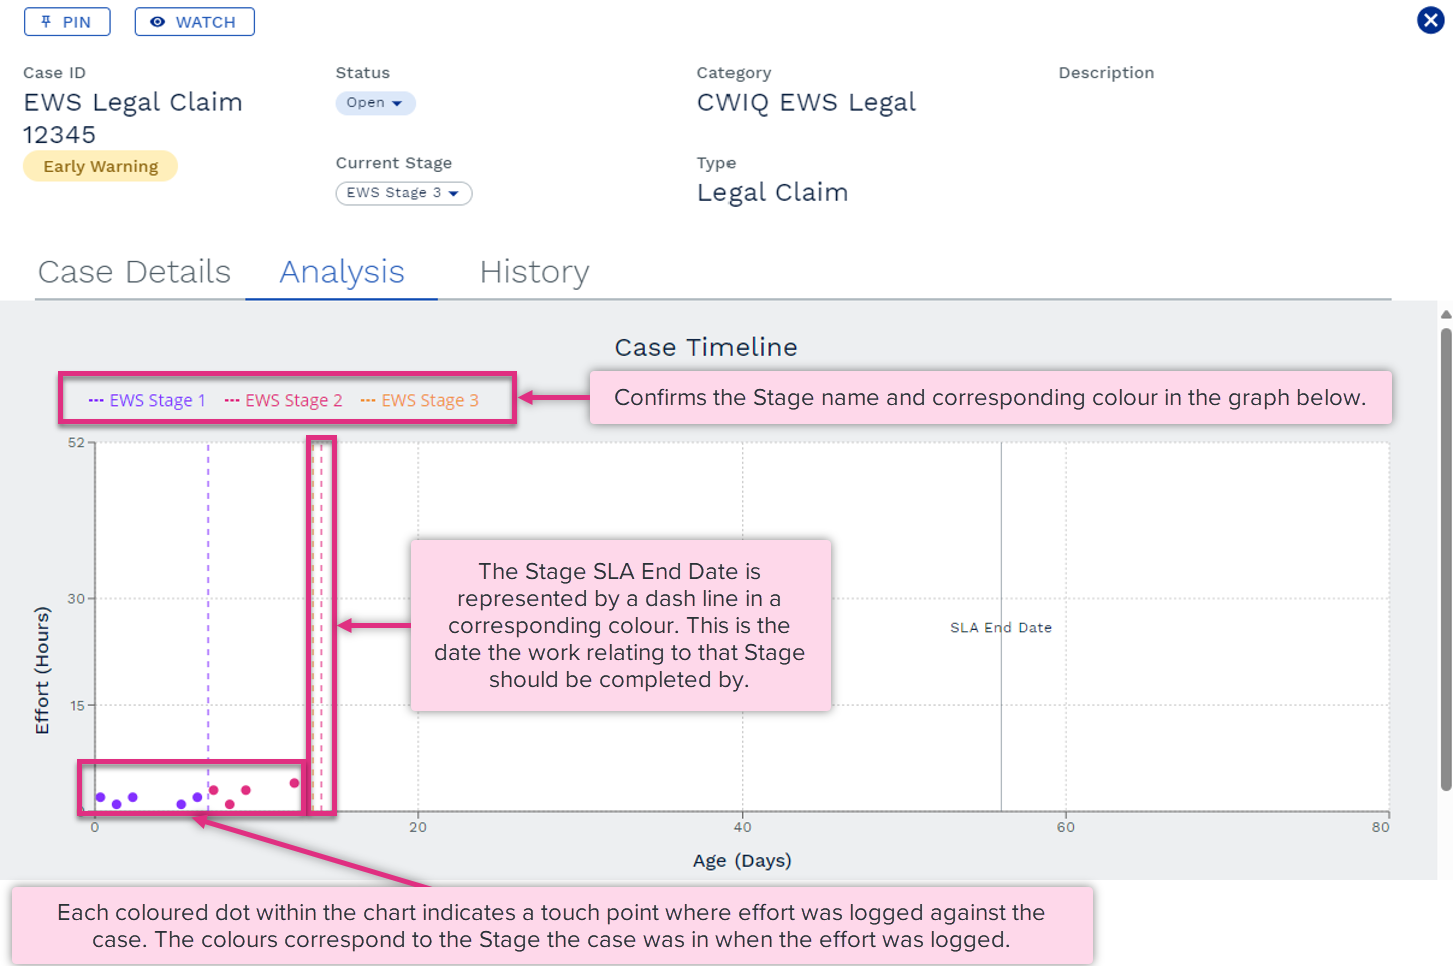
The Case Analysis tab allows you to view details of the cases journey so far in terms of the Stages it has passed through, and the effort captured against each Stage and the case overall.
The Case timeline chart illustrates each time the selected case was touched, and which stage it was in when the effort was captured along with the expected points at which the case should have progressed from one stage to the next.
Case Timeline Chart
|
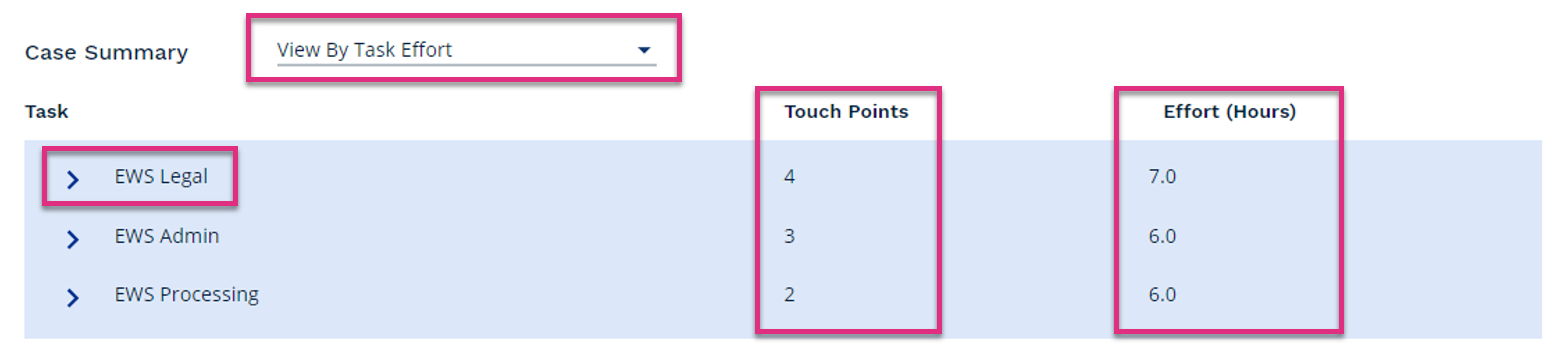
Case Summary
The Case Summary table allows you to further expand the data to view what tasks each touch point related to, how much effort was captured and by whom.
View By Task Effort
View By Task Effort
Expand
Task
Touch Points
Effort (Hours)
|
||||||
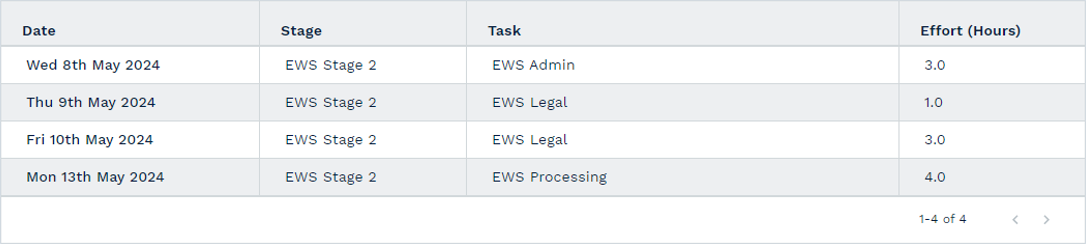
 icon next to a task name will expand the data further to display each touch point in the cases journey where effort was captured against that core task for the selected case.
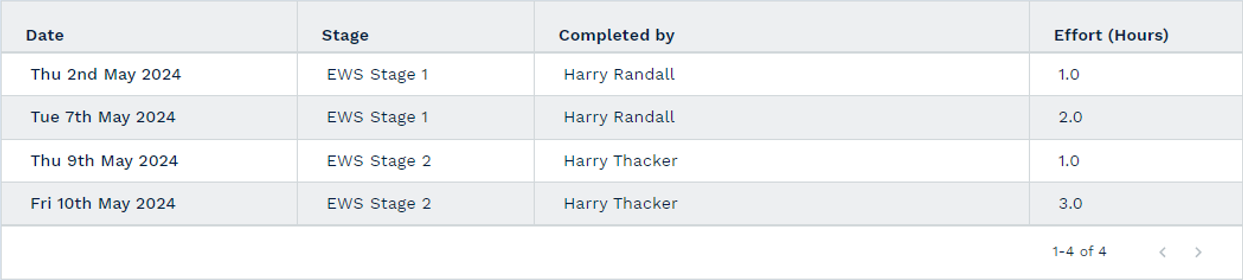
View By Staff Member
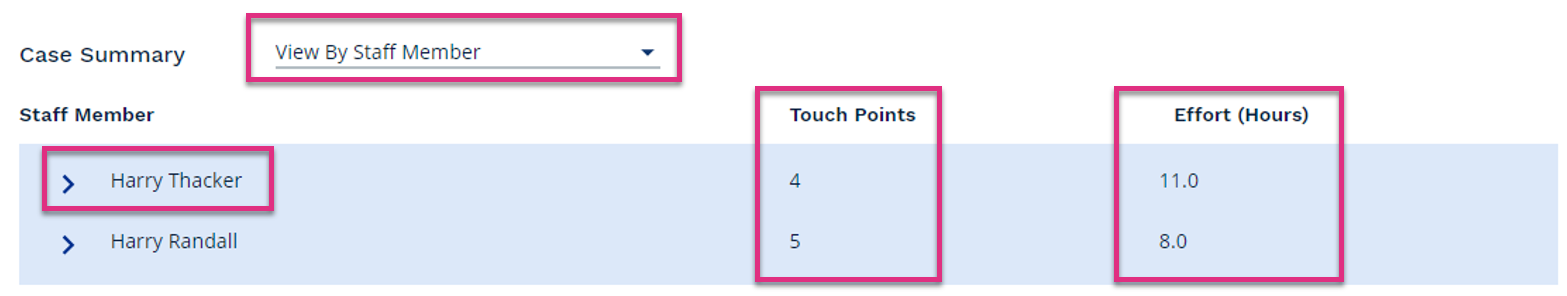
View By Staff Member
Expand
Task
Touch Points
Effort (Hours)
|
||||||
The Case History screen allows you to view the different touch points of a case as well as touch points made during the different case stages if this feature is enabled
|
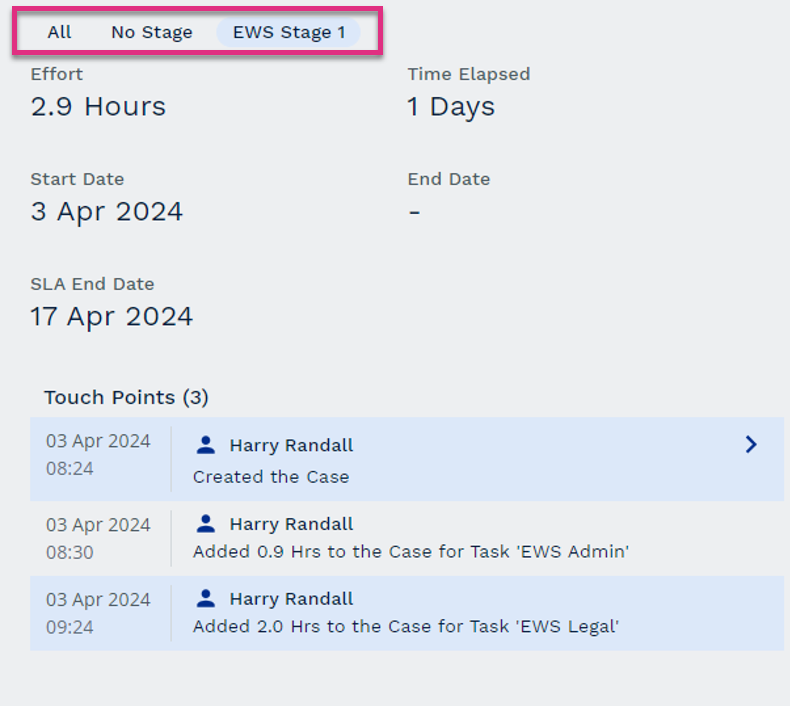
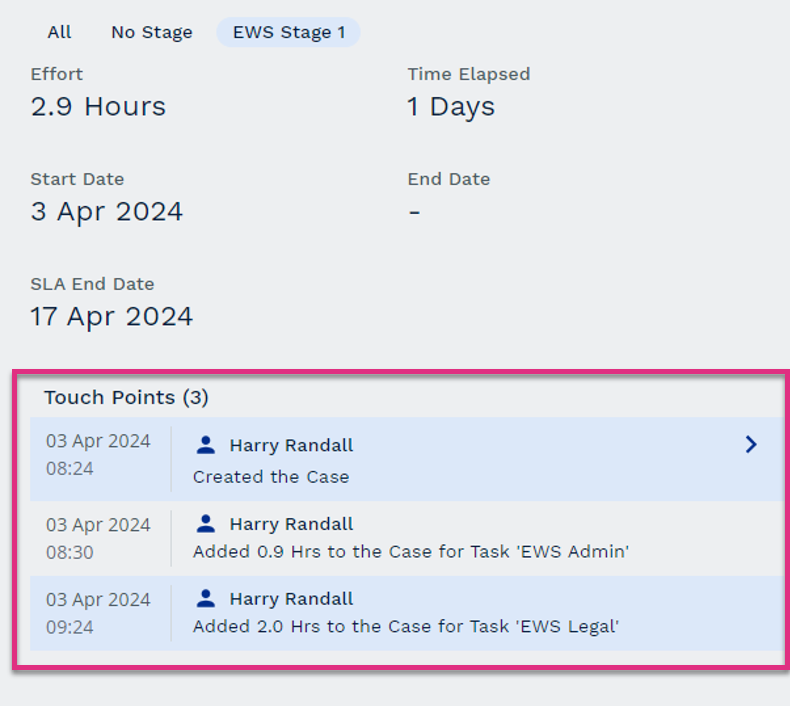
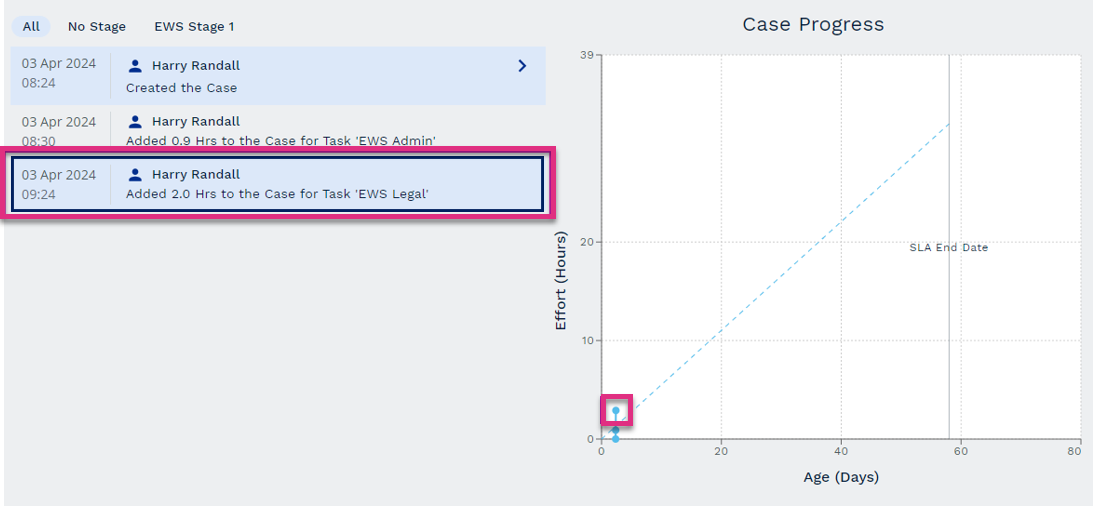
The Case Progress graph illustrates the total effort captured against the case to date compared to the estimated trajectory as well as each of the individual touch points.
The estimated trajectory is based on the SLA end date assigned to the case and the estimated effort required to close this case.
Placing your cursor over an individual touch point on the graph will highlight that data point in the Touch Points list.
If effort has been captured against a task and the task stage is different to the current case stage that data point will display a warning symbol  in the graph and the Touch Points list.
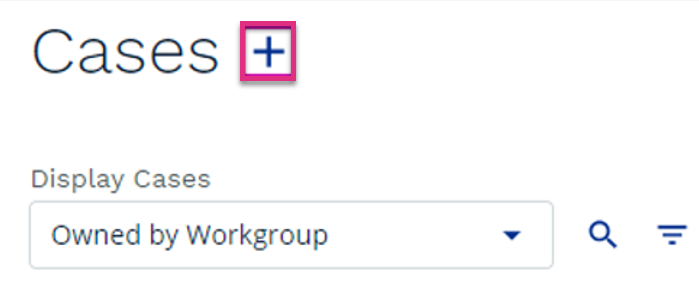
As well as reviewing existing cases you can also create new cases from the Cases screen. To create a new case, select the  button next to the Cases header.
|
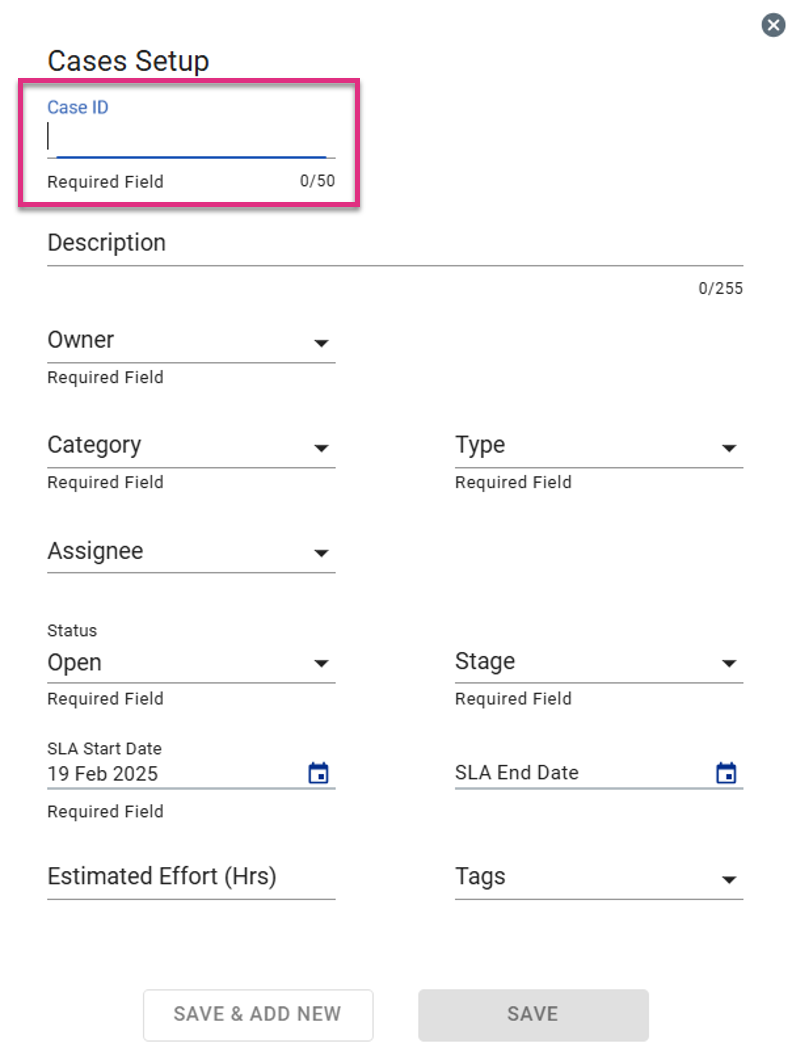
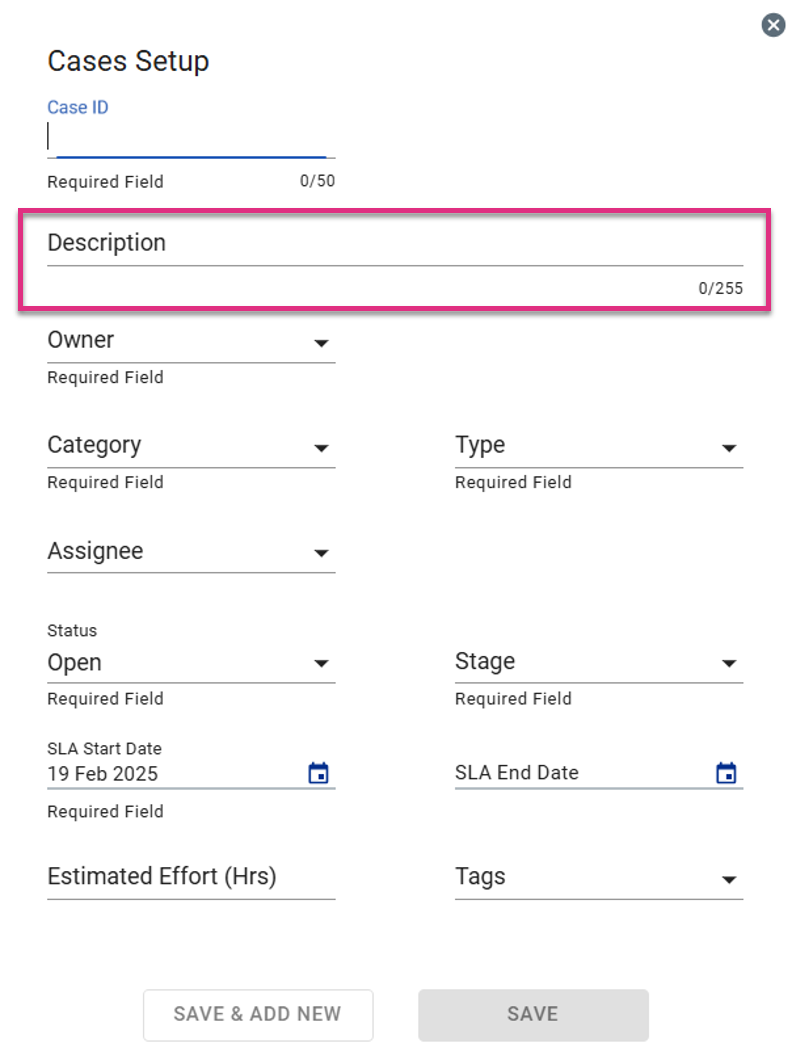
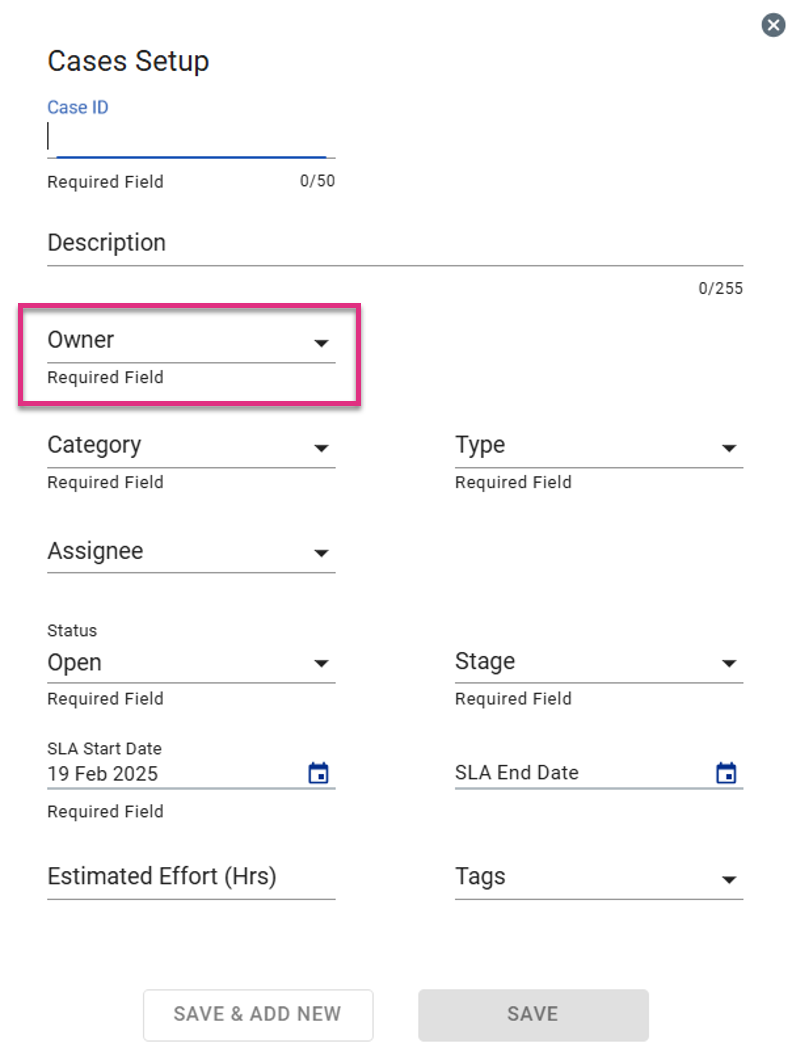
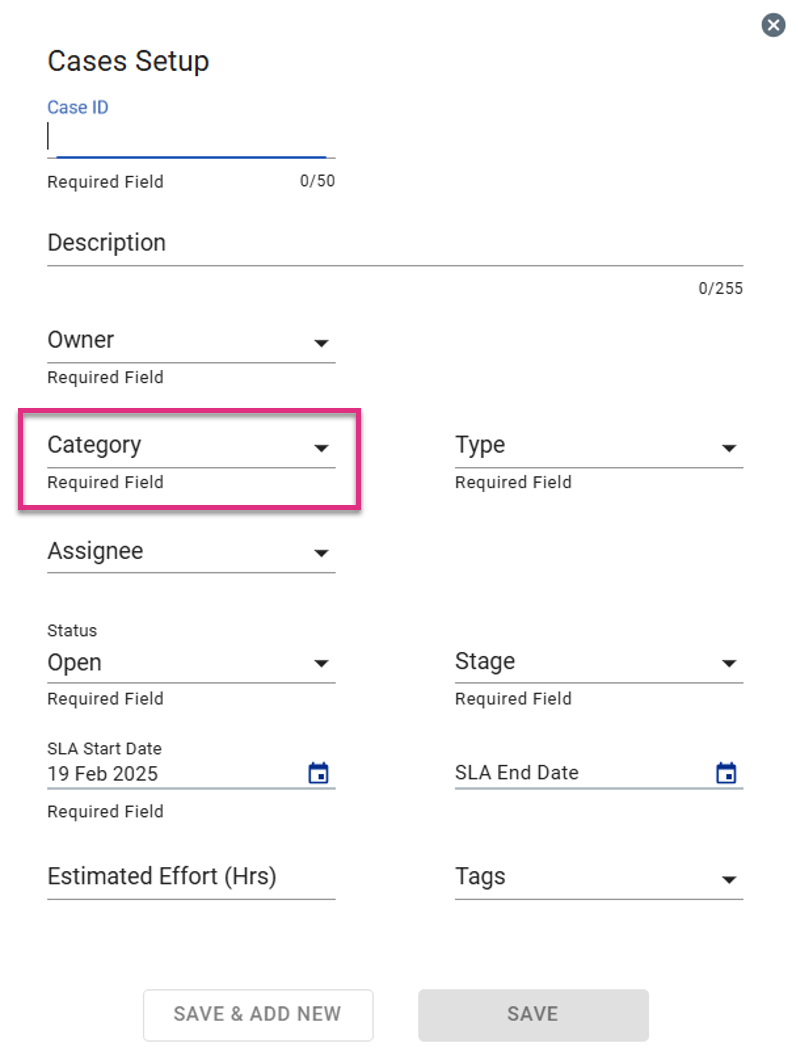
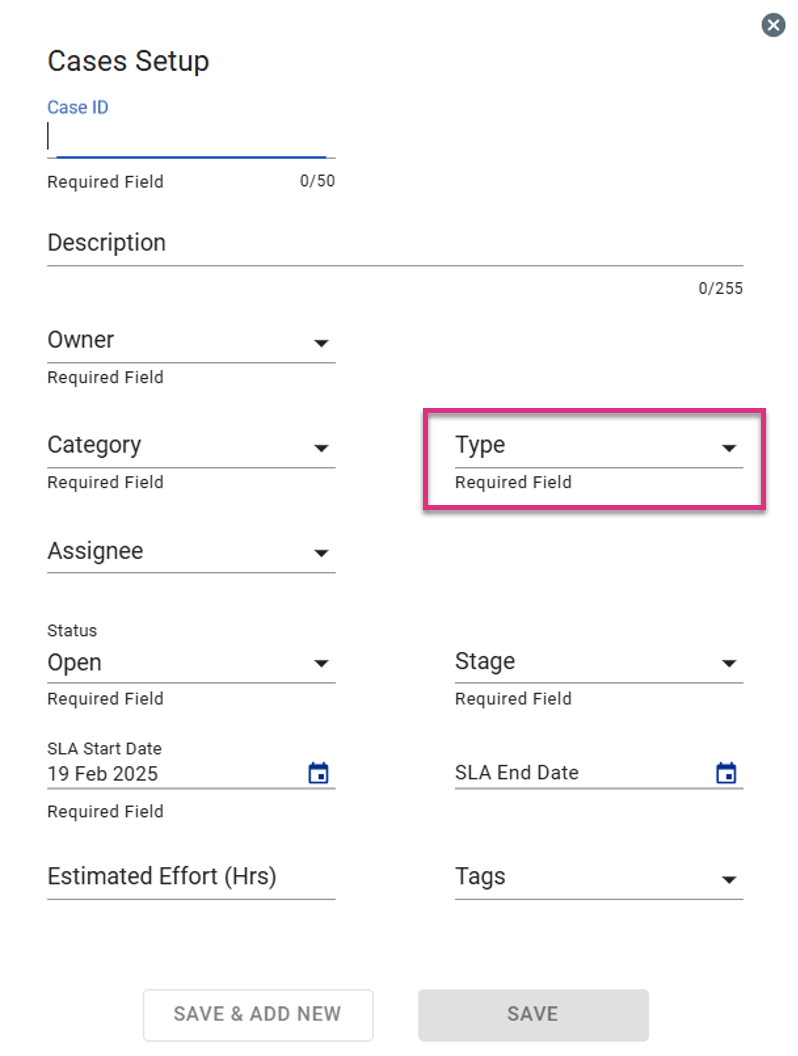
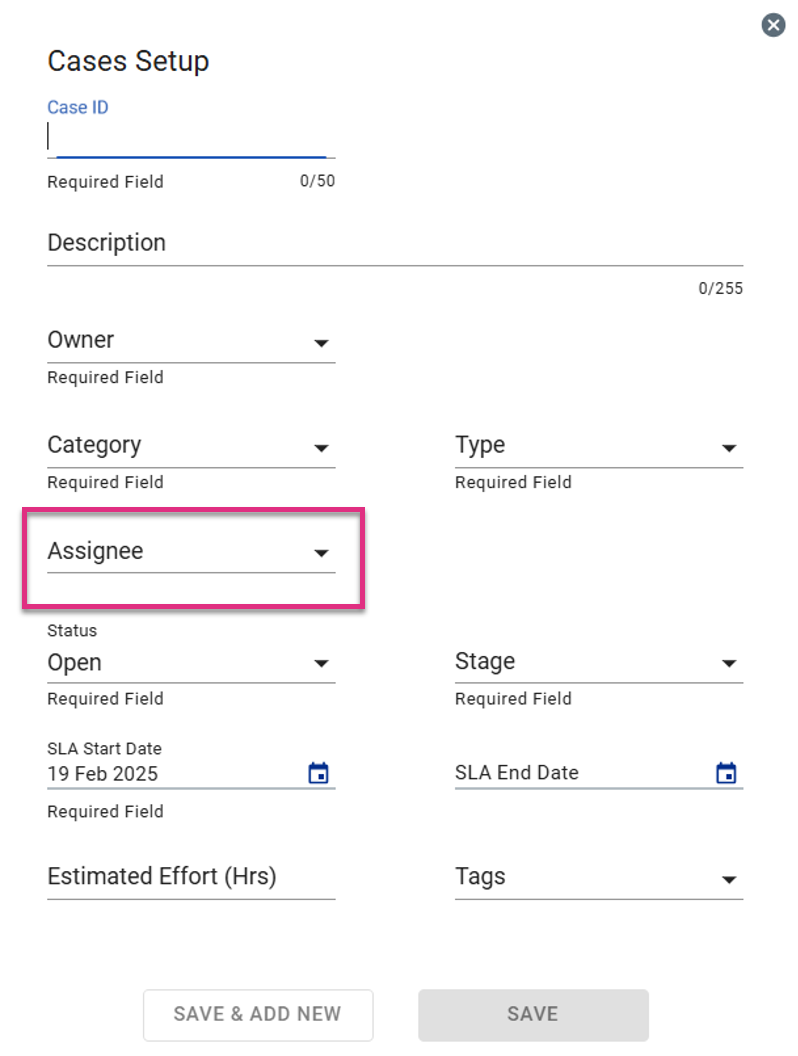
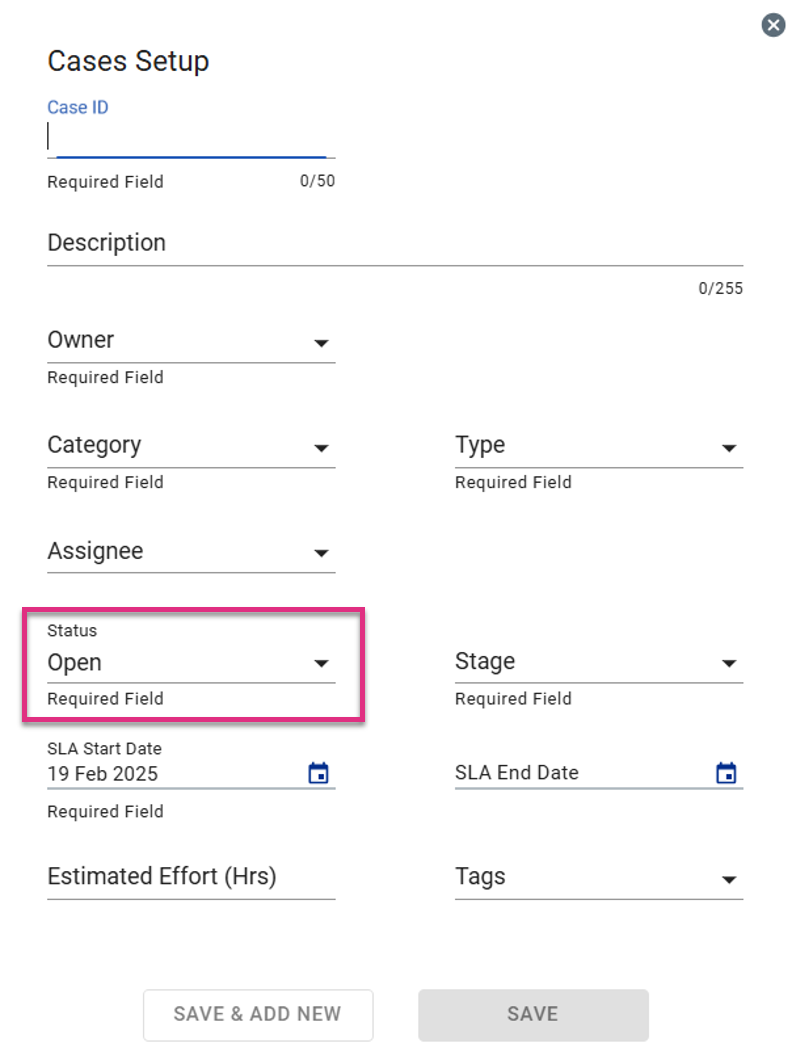
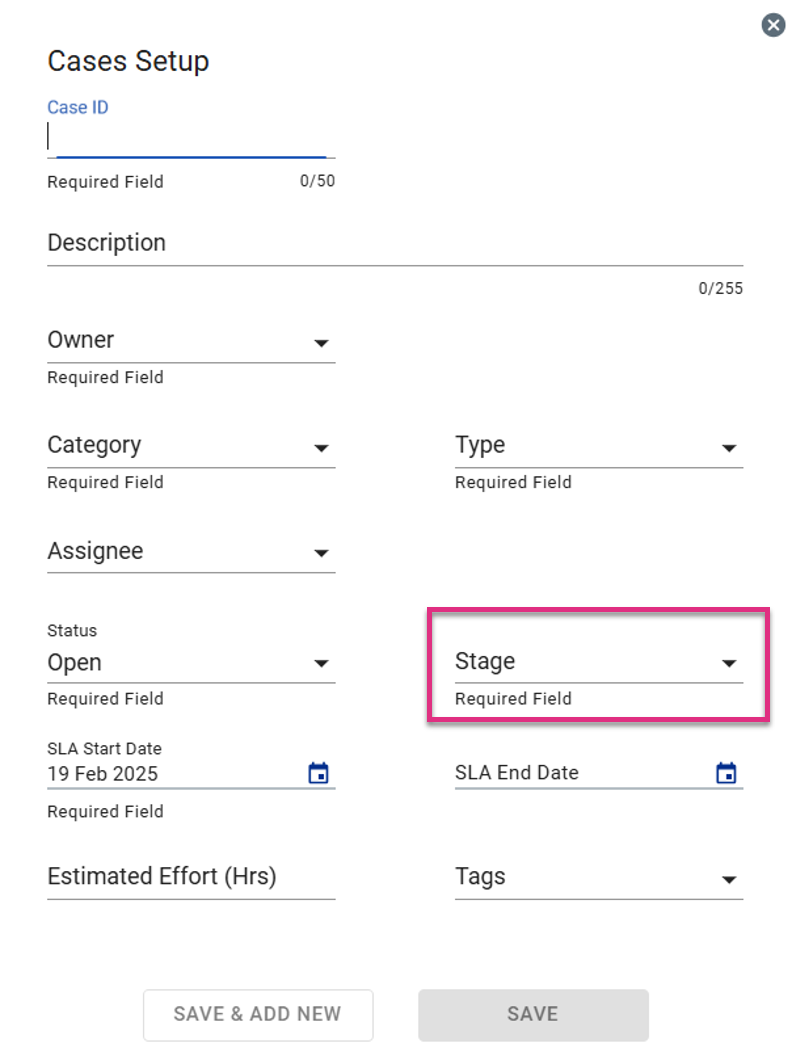
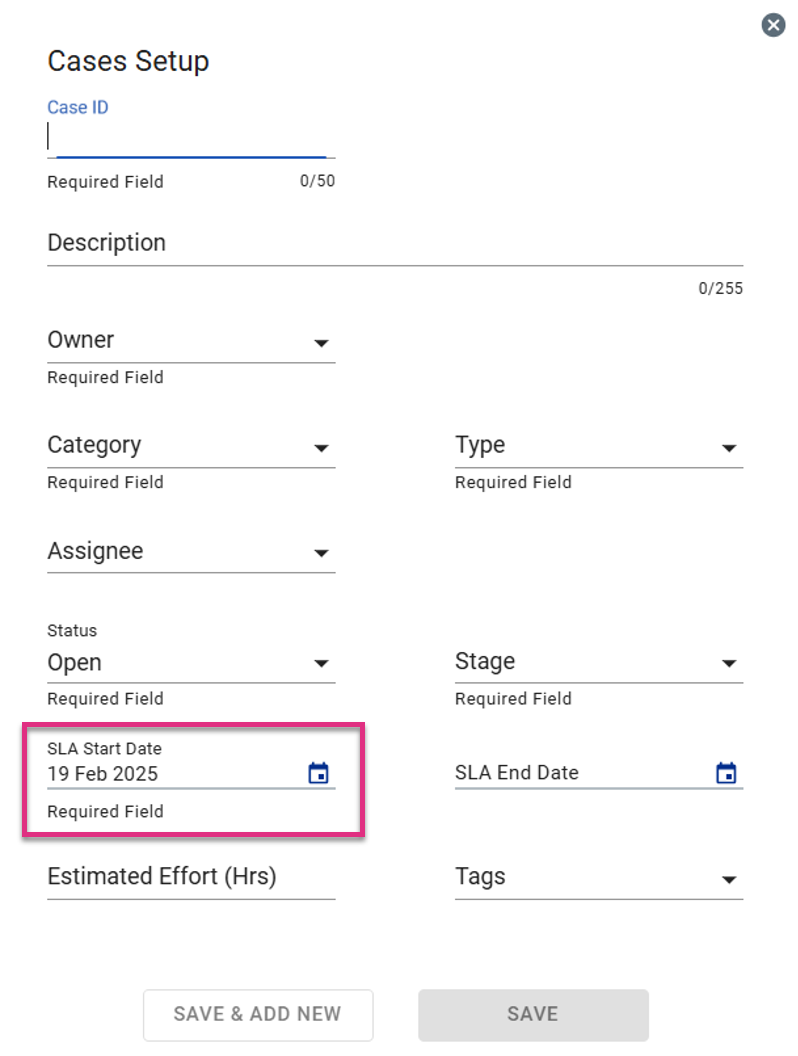
Once you click Save the new case will appear in the Cases Screen but also be available via the Case Worklog for team members to capture data against.


