Smart Skills Centre
| SERIES 4.0 FEATURE |
Overview
The ControliQ Smart skills Centre allows you to set skill level targets for the core tasks completed in your workgroup. This allows you to manage flexibility and contingency to ensure that you have enough skilled team members to complete the required volumes of core work.
You set the targets for the number of team members you require with skills for each task and based on their recent performance when completing the tasks the Smart Skills Centre will provide you with a view of how you are progressing against those targets every month.
To utilise the Smart Skills Centre, you first need to set targets for each of your workgroups core tasks. This target indicates how many team members you require with skills in each task to manage demand.
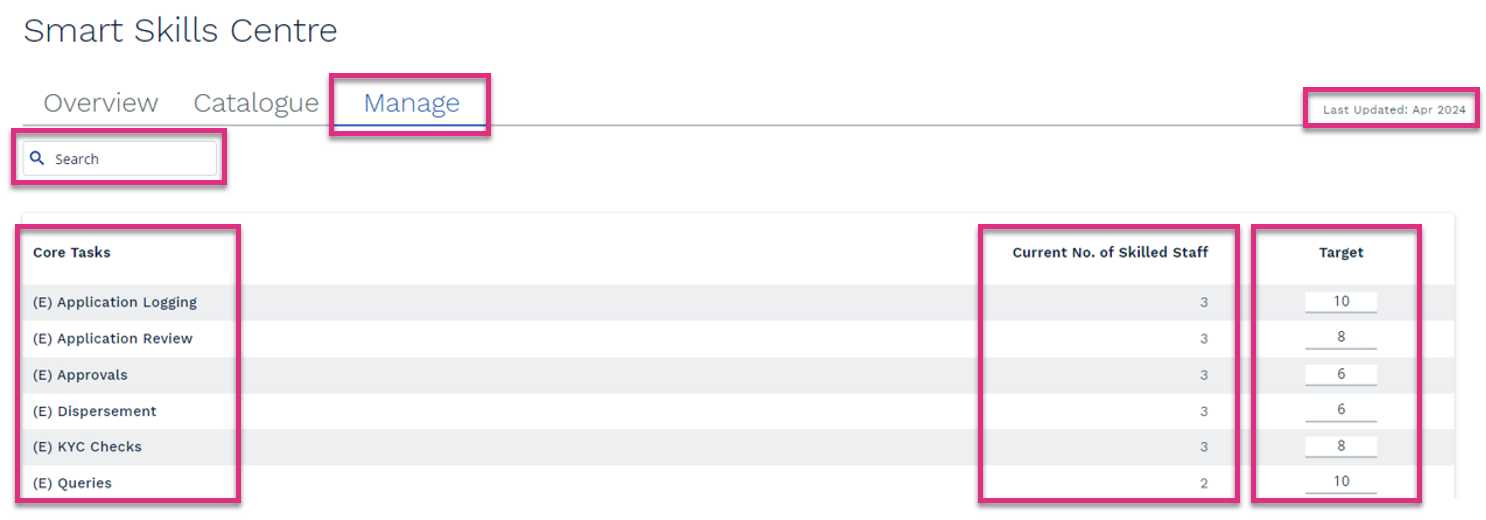
Search
Core Tasks
Current No. of Skilled Staff
Target
Last Updated
|
Once you have set your targets you can review current progress against them in more detail using the Catalogue. This details the teams progress against target and the individual team members that have skills in each task. When reviewing this data, you have 2 options on how the data will be displayed.
The Core Task View will display the teams progress against targets for each task at the highest level.
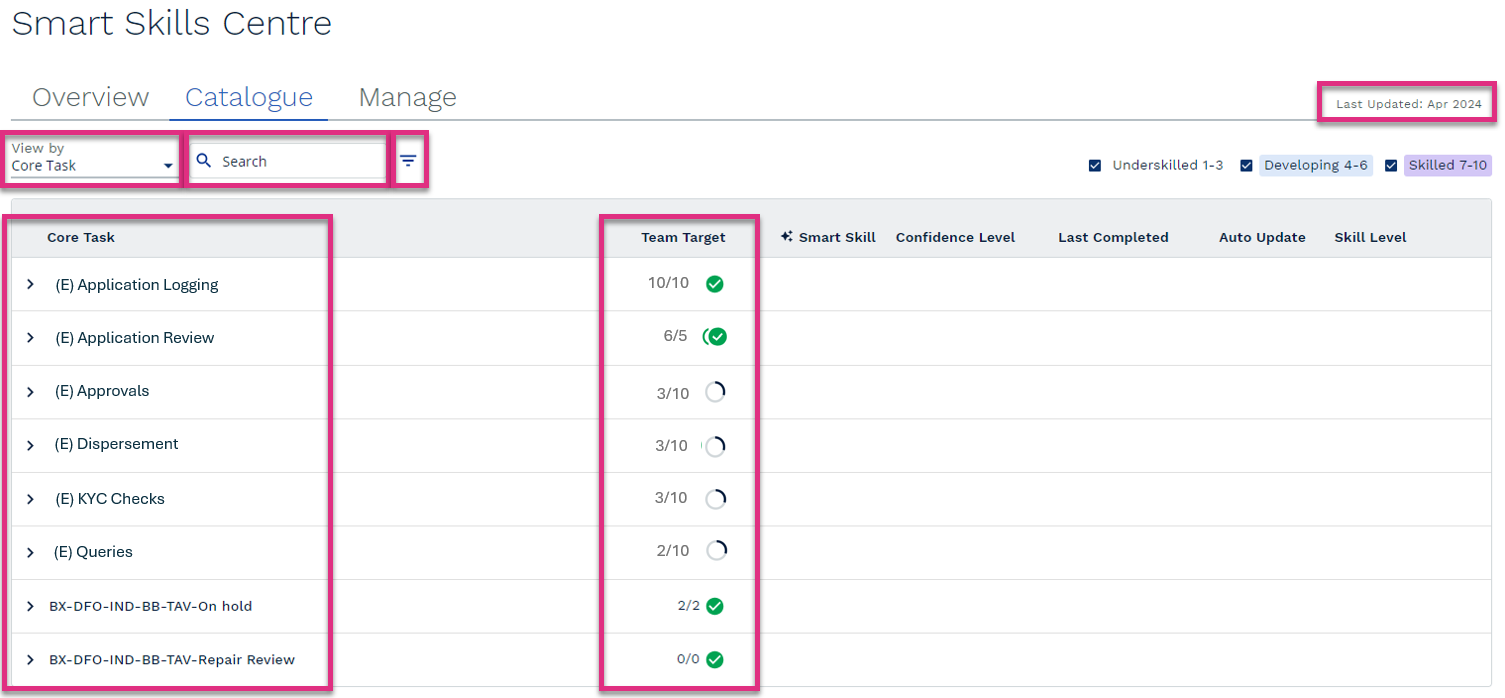
View By
Search
Filter
Core Task
Team Target
Last Updated
|
 The target has been met; the required number of team members are skilled in this task.
 The target has not yet been met; more team members need to become skilled in this task to meet the target set.
 The target has been exceeded, there are more team members with skills in this task than targeted.
|
The Skills catalogue can be exported to Excel by clicking on the |
Selecting the  icon next to a Core Task name will expand the data further to display the team members linked to the selected workgroup and their skills in that task.
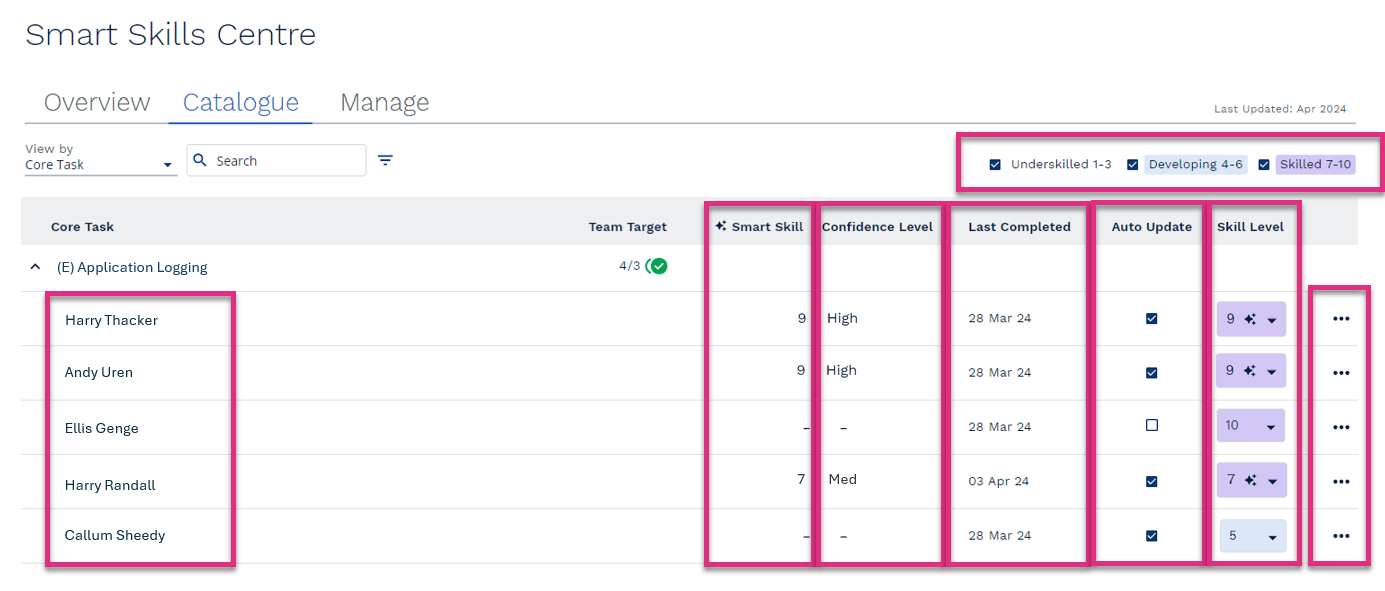
Name
Smart Skill
Confidence Level
Last Completed
Auto Update
Skill Level
|
|||||||||
 Indicates that Smart Skills Auto Update is enabled, and the skill level will automatically be updated as part of the monthly Smart Skills review.
 Indicates that Smart Skills Auto Update is not enabled, and the skill level will not automatically be updated as part of the monthly Smart Skills review.


 icon next to the skill level. If this icon is not displayed it indicates any skill level displayed has been entered manually.
 icon next to the current skill level and select the required one from the drop-down menu.
|
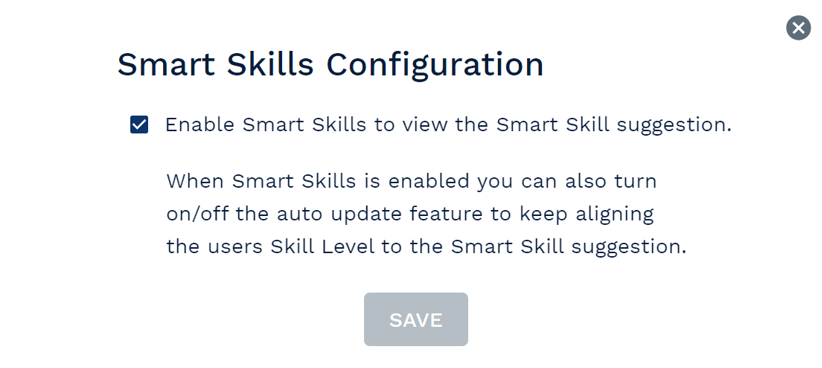
Selecting the Clicking the icon will prompt the Smart Skills Configuration button to appear.
Clicking the Smart Skills Configuration button will allow you to enable or disable Smart Skills for the selected team member.
To enable Smart Skills make sure the checkbox is selected To disable Smart Skills make sure the checkbox is deselected |

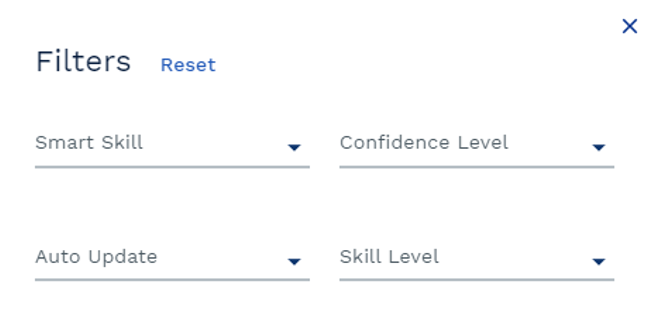
Skill Filters
|
These filters allow you to refine the list of team members displayed when Core Task data is expanded. De-selecting the checkbox next to Underskilled, Developing or Skilled will remove individuals whose skills fall within those parameters from the list of team members displayed. |
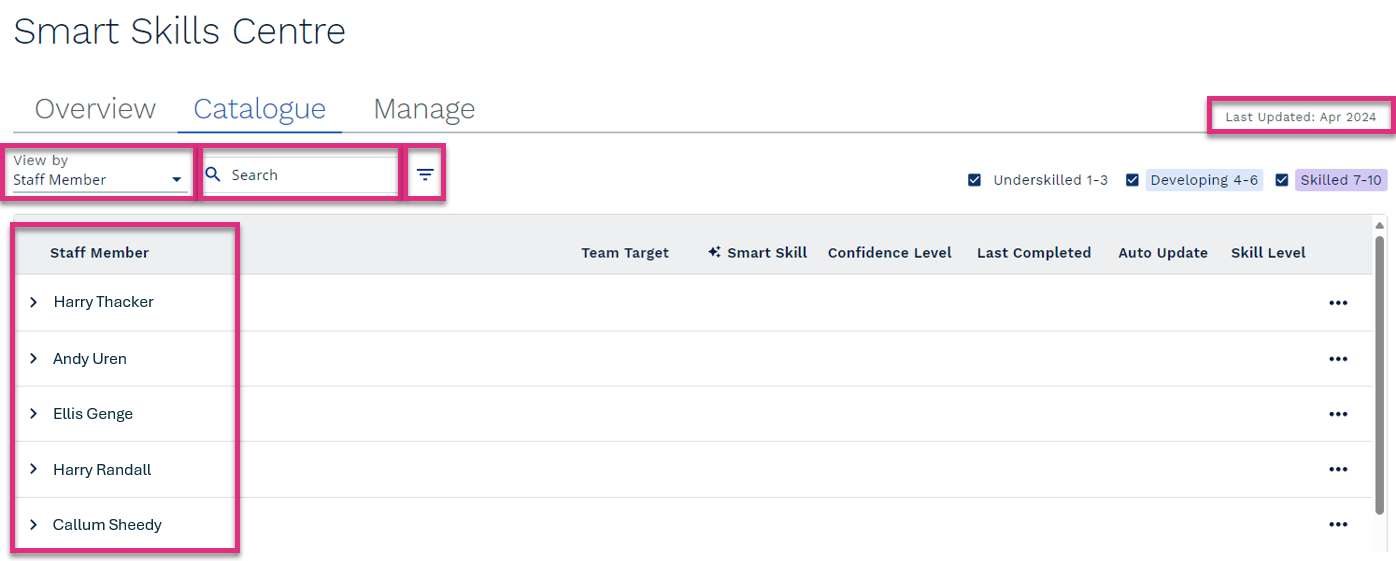
The Staff Member View will display the staff members skill in each core task linked to the workgroup at the highest level.
View By
Search
Filter
Staff Member
Last Updated
|
||||||
Selecting the icon next to a Team Members name will expand the data further to display the Core Tasks linked to the selected workgroup and their skills in that task.
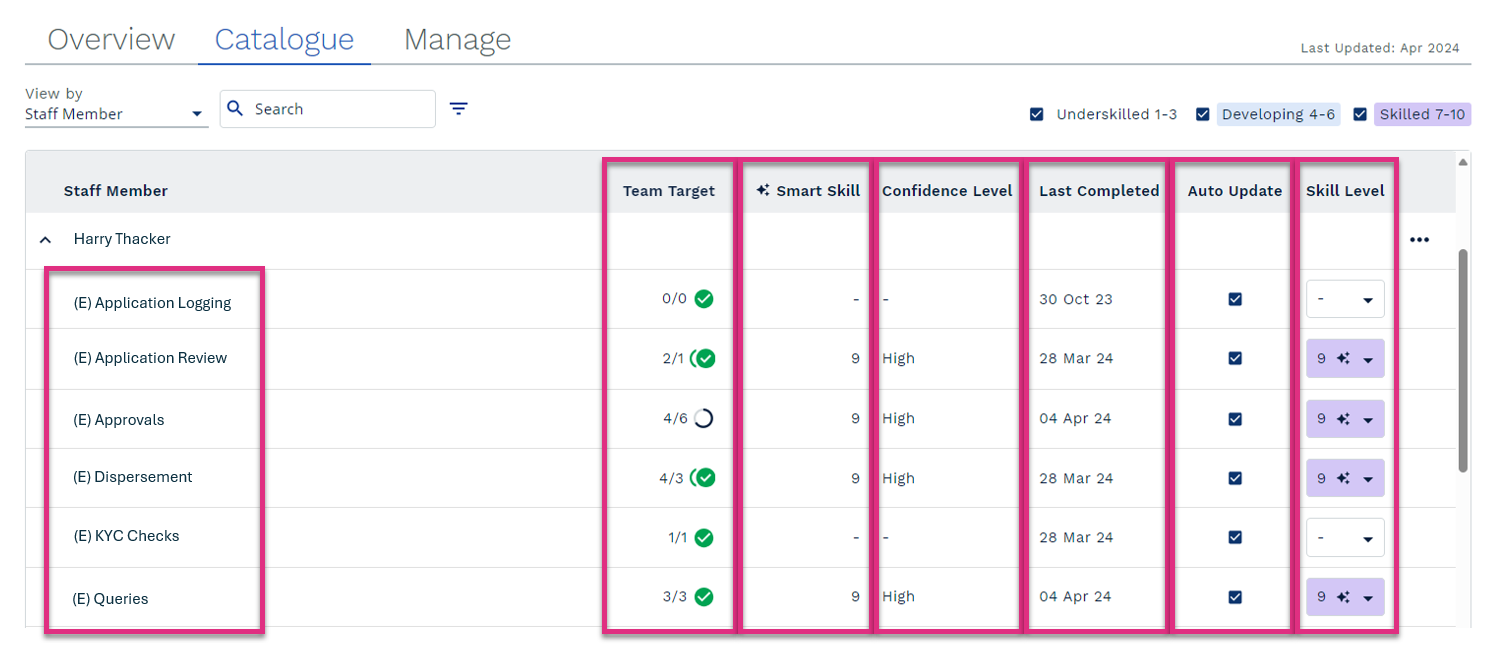
Task
Team Target
Smart Skill
Confidence Level
Last Completed
Auto Update
Skill Level
|
||||||||
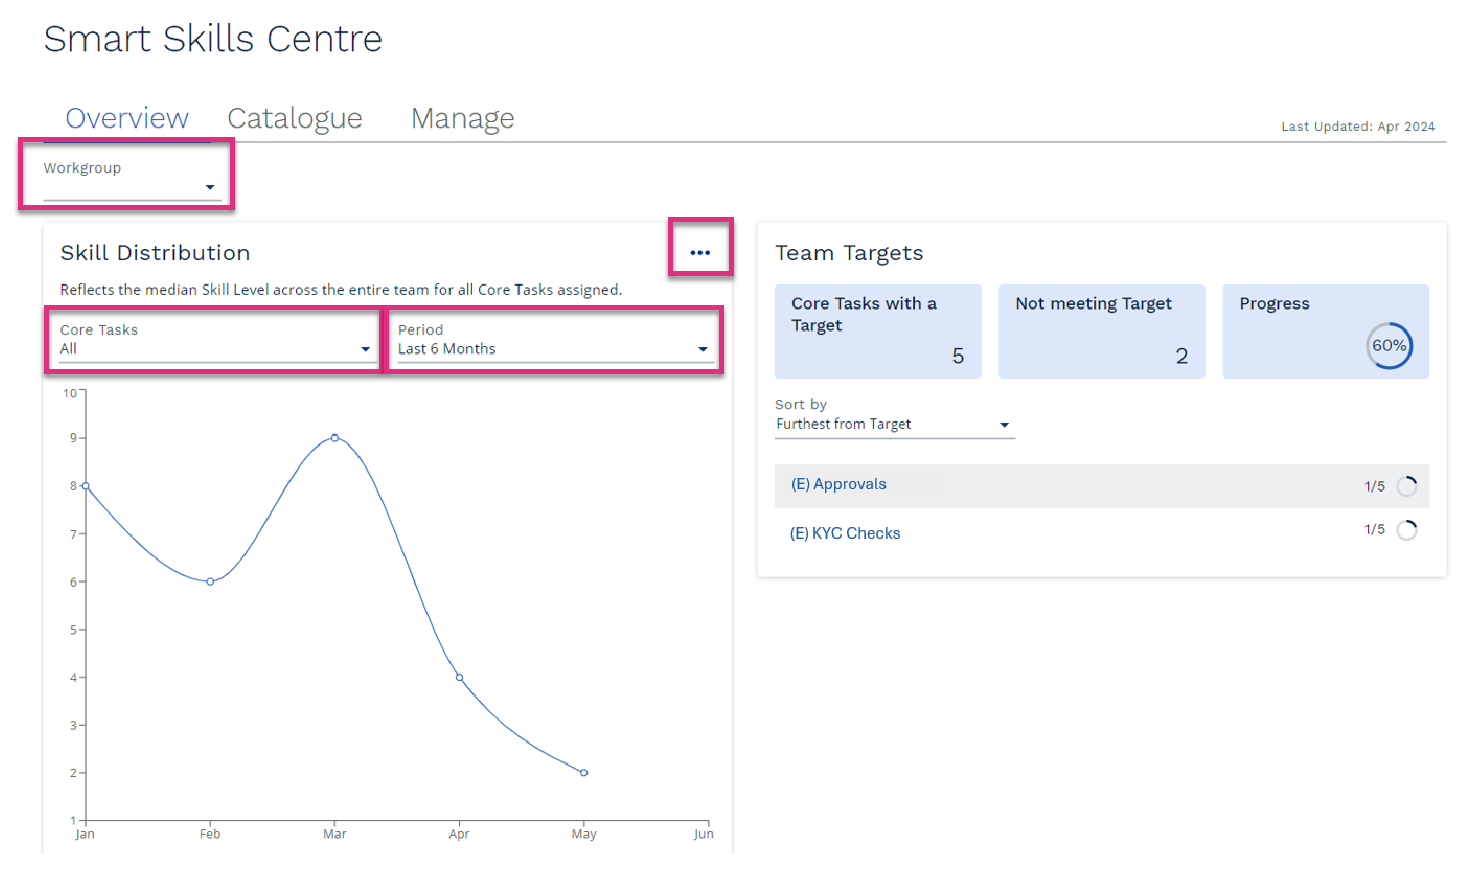
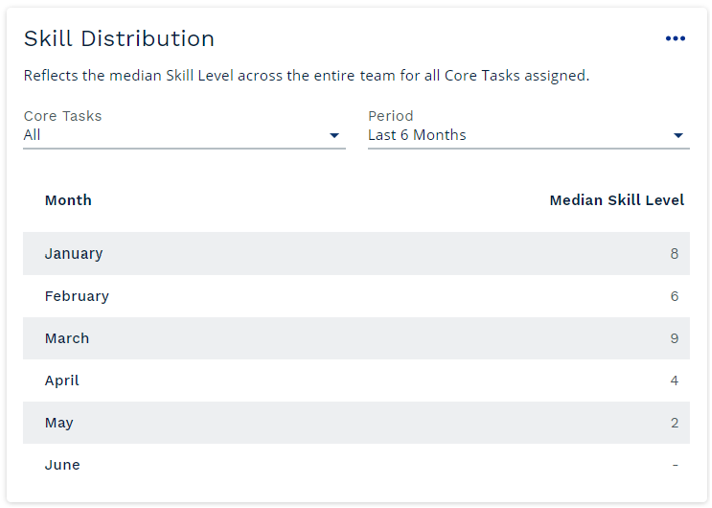
The skills distribution section of the overview tab gives you a view of the overall skill levels of the team members linked to the selected workgroup across the past 6- or 12-month period. The chart illustrates if the overall skill levels of the team are increasing or decreasing.
Workgroup
|
||||||
|
Click the
|
Core Tasks
|
Select All core tasks to review the overall skill level of the selected workgroup or individual core tasks from the drop-down menu. Any tasks linked to the selected workgroup during the period being reviewed will be displayed. |
Period
|
You can choose to view the skills distribution data for the past 6 or 12 months by selecting the required time period from the drop-down menu. |
Median Skill Level and Month
|
The Skills distribution data provides a view of the median skill levels of the team members linked to the workgroup for the past 6 or 12 months and illustrates if the skills of the team are increasing or decreasing. All Core Tasks – When All Core tasks is selected the Median Skill Level for each month is based on the median overall average skill level for each team member. It is the mid-range average score of the whole team for all tasks. 50% of the team members average skill level sits above the median and 50% of the team members average skill level sits below the median. Specified Core Task – When a specific Core Task is selected the Median Skill Level for each month is based on the skill level of every team member linked to the workgroup for each month for the selected Core Task. 50% of the team members have a skill level higher than the Median and 50% have a skill level lower than the Median. Please note the Median will be rounded to the nearest whole skill level. |
The Team Targets section of the Overview tab allows you to see how the selected workgroup are progressing against the skills targets they set for their core tasks.
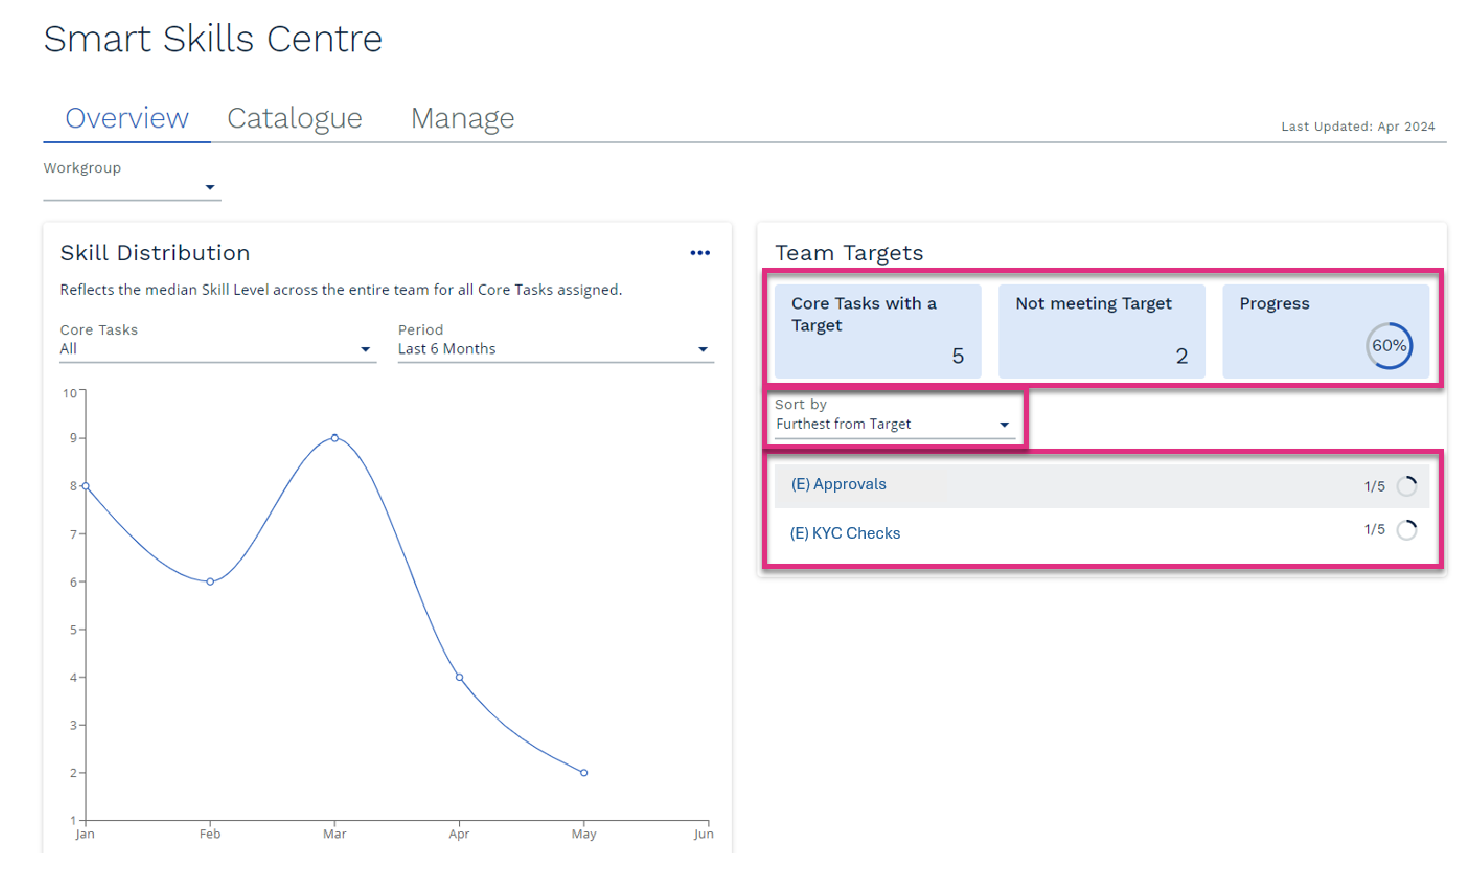
Overview Tiles
Sort By
Core Task Progress to Target
|
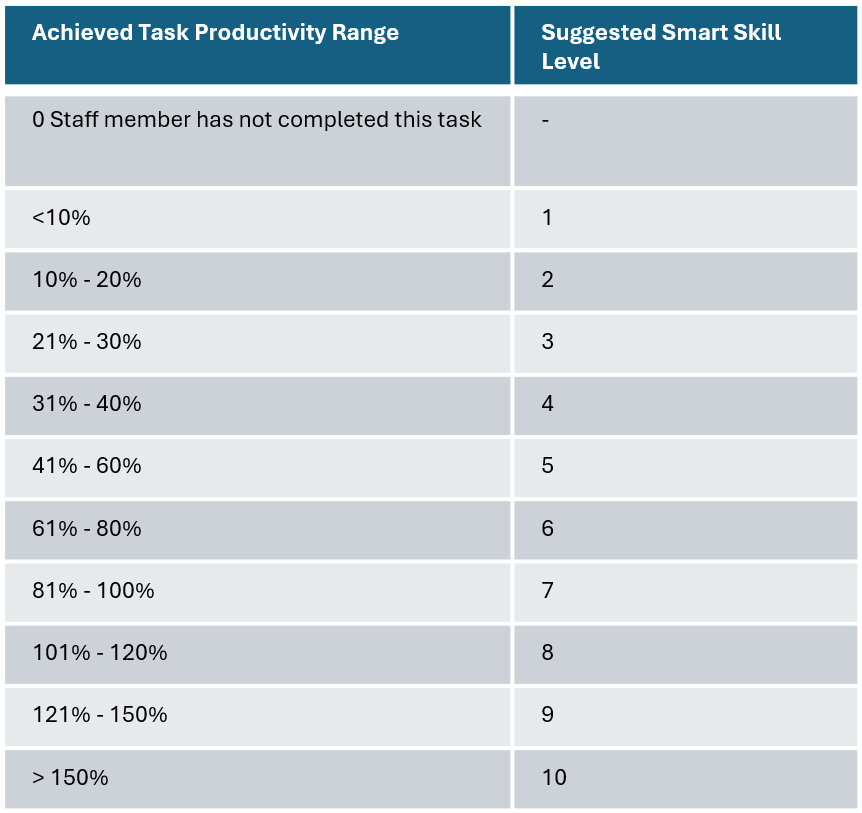
Smart Skill levels are based on the previous 90 days of data, and will consider both estimated Task Productivity, and Quality scores if these are recorded for individual team members in ControliQ.
Task Productivity
In ControliQ, there are many methods to capturing data. As a result, we cannot simply measure the time between a user hitting +1 in RTM to understand Task Productivity. As an accurate and consistent alternative, we estimate task productivity with the help of machine learning algorithms.
Task Productivity is derived from using the total Core Time for the day, and the history of Work Out recorded that day. This logic is then applied across the entire 90-day period analysed.
Equation:

Step 1 (Estimate)
To solve the equation above, we need to know the Task Core Time.
To do this, we start the estimation process with an initial estimate of 100% Task Productivity for every task.
Steps 2-4 (Test, Improve, Optimise)
Using this initial estimation, we can solve equation (above), and then sum together all of the Task Core Time values for the day and see how close it is to the actual Daily Core Time.
After observing the difference, we iteratively improve on this estimate of 100% Task Productivity, so that the difference in the sum of all Task Core Time and actual Daily Core Time is as close to 0 as possible.
This process of iteratively improving the Task Productivity values and re-testing the difference is made possible using our machine learning algorithm.
The machine learning algorithm will loop through this process, learning with every attempt if the result is getting closer to 0 and will adjust the estimation accordingly. This process will continue until the most stable and best fit result is found. The end result is the most optimal Task Productivity for each task.
To provide the final Smart Skill, we forecast the estimated Task Productivity for the upcoming month using a special moving average. The result is then factored by the ControliQ quality score (if applicable), before being associated with a Skill Banding to derive the Smart Skill of each Staff Member, for each Core Task
Applying Quality
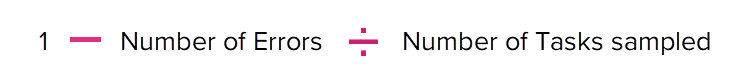
If individual quality data is being captured this will also be used in the Smart Skill calculation. this is calculated as:
The task level productivity estimate is then multiplied by the quality percentage to get the final task level productivity including quality.
The calculation for this is:

For example:
Quality Errors: 20
Quality Sample: 80
Task Productivity = 112%
1 - 20 / 80 = 75%
112 x 0.75 = 84%
Original Skill Level is 112% = 8
New Skill Level factoring Quality is 84% = 7


