Rigour Indicators Report
Overview
The Rigour Indicators Report allows you to review how effectively you, or your managers are following the AOM methodology. The report looks at performance in 4 keys areas over a 4-week period. Weekly reviews of this report can help you identify teams that are practising AOM well and those who might need more support.
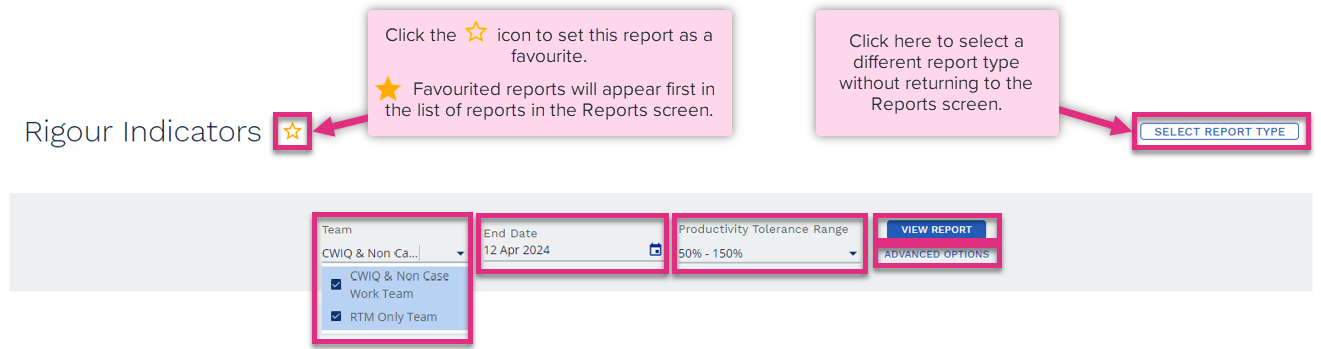
Team
End Date
Productivity Tolerance Range
Advanced Options
View Report
|
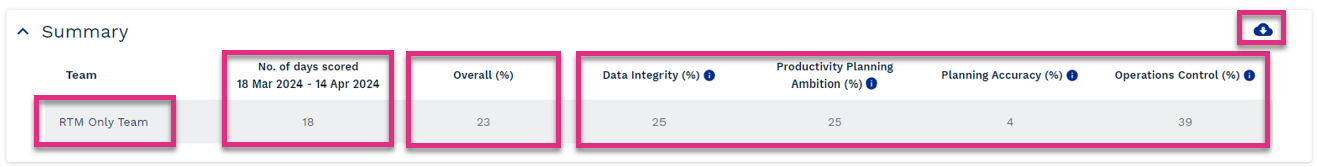
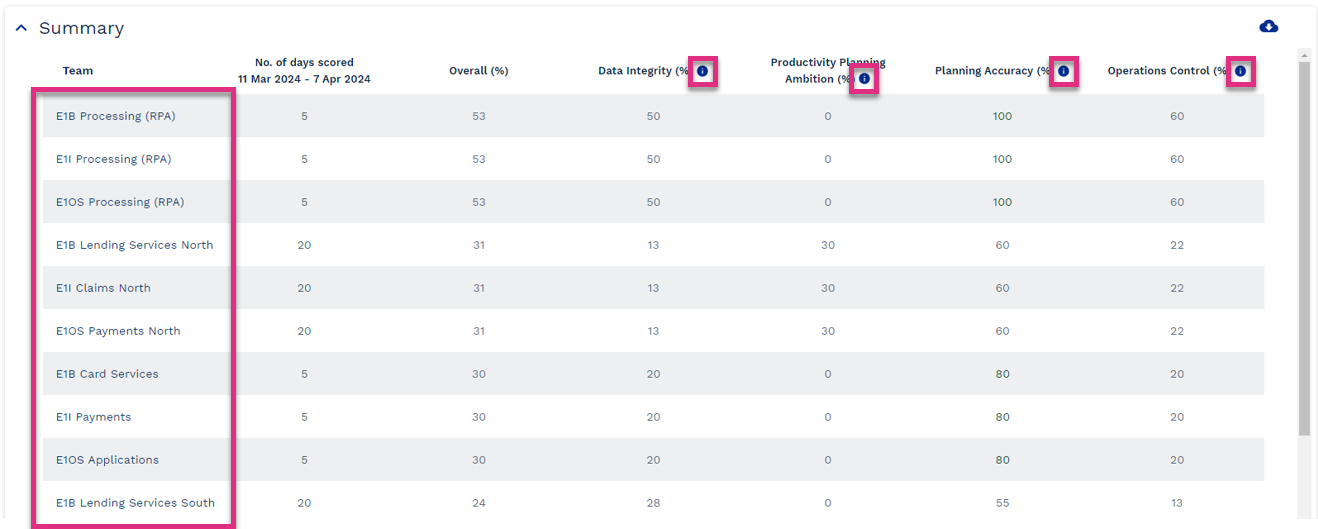
Team
No. of days scored
Overall
Rigour Categories
Export
|
 icon allows you to expand each area to understand what is driving each of the scores.
 icon to export the report to Excel.
The data integrity area gives an indication of how well the daily data verification process is being completed and is based on the data verified in the Manage Data screen.
Days Manage Data was updated before COB next day, this section is reviewing the timeliness of data verification. Un-verified data does not populate reports in ControliQ therefore to follow the method captured data needs to be verified on the following working day.
This score is looking at the total working days in the 4-week period and on how many of those days was the data verified by close of business on the next day. For example, a score of 18/20 means that data was verified by close of business the next day for 18 out of a possible 20 days.
Clicking on the score in this section will expand the data so you can review the days and data points where the verification didn’t happen by close of business.

Date
Name
Actual Date of Verification
|
| Please note:- going back and amending previously verified data beyond close of business the next day will cause that data to flag here and reduce your overall score. |
Days Productivity was between 50% and 150%, this section is reviewing the quality of data verification, flagging where data that may contain errors has been verified.
The score is looking at the total working days in the 4-week period and on how many of those days no team members had Productivity scores outside of the specified range. For example, a score of 18/20 means that there were 2 days out of the maximum 20 where there were team member productivity scores that sat outside of the specified range.
Clicking on the score in this section will expand the data so you can review the days and data points where errors in the data may have been missed.
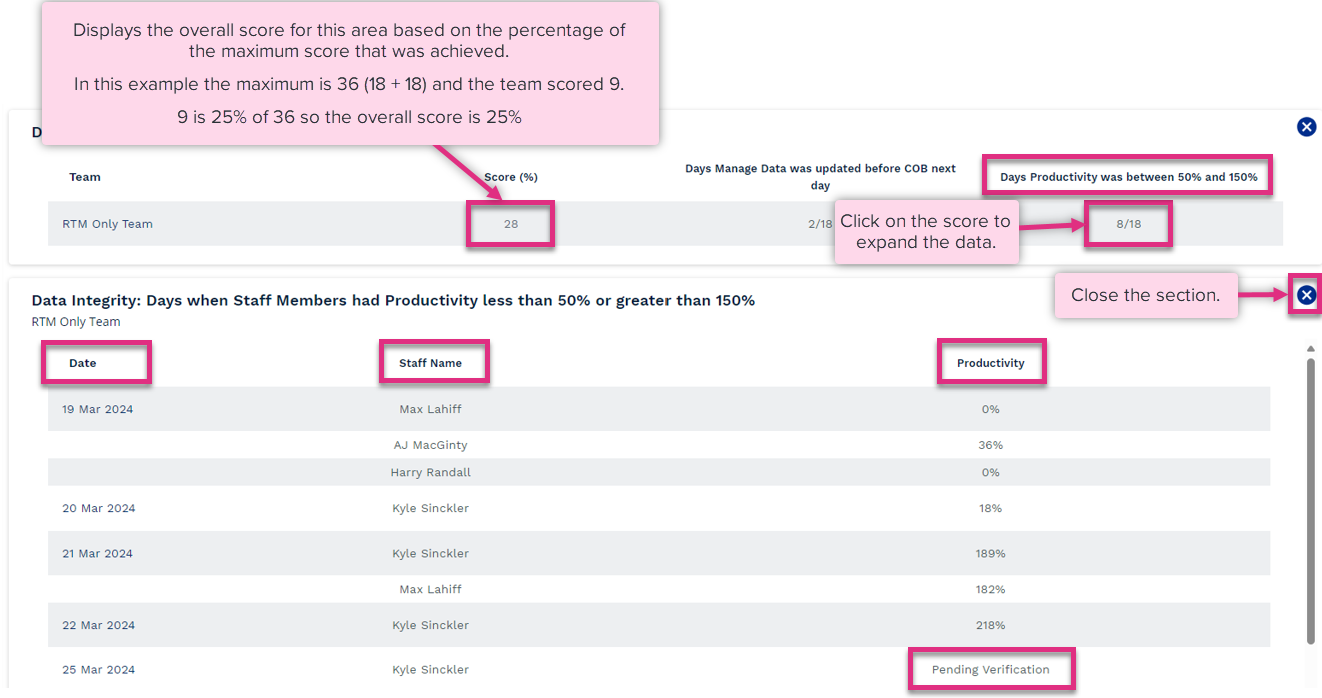
Date
Staff Name
Productivity
Pending Verification
|
The Productivity Planning Ambition area is looking at how challenging the weekly plans that are being built are. To drive improvement, you need to plan for improvement, so this area is looking at how close to the 85th percentile productivity managers are planning at and if the targets being set represent a challenging but achievable target.
In the Rigour Report when looking at Productivity Planning Ambition, the 85th percentile value used for comparison is based on 4 weeks of historical data, if users have configured their plans to utilise a different number of weeks to calculate their 85th percentile you may seem some discrepancies in the report.
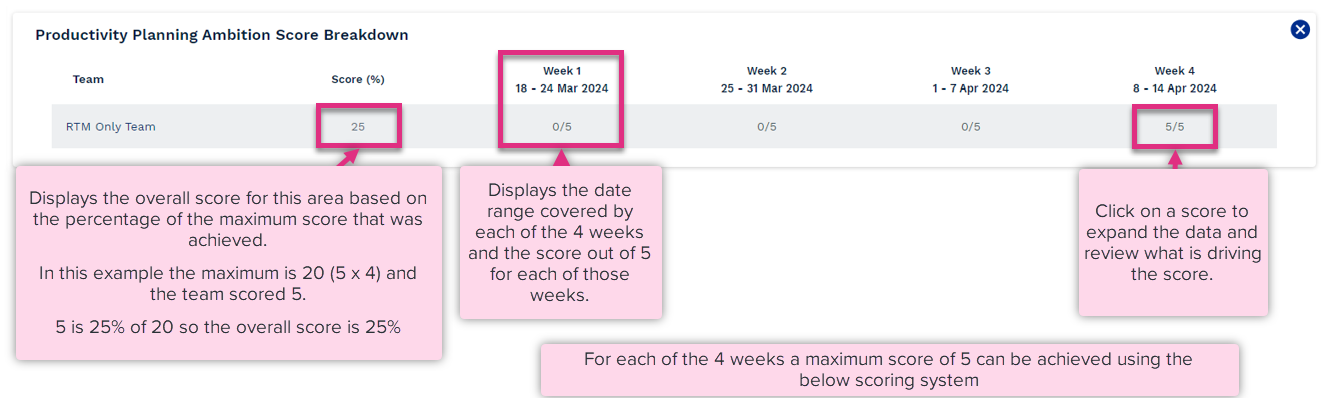
| Score | Description |
|---|---|
| 1 / 5 | The planned productivity is greater than or equal to the 100th percentile, this represents a level the team have not achieved in the past 4 weeks. This target is to challenging. |
| 5 / 5 | The planned productivity is between the 75th and 99th percentile, this represents a challenging but achievable target. |
| 3 / 5 | The planned productivity is between the 50th and 74th percentile, this represents a level the team have achieved and exceed multiple times in the past 4 weeks. It is not a challenging target. |
| 0 / 5 | The planned productivity is less than the 50th percentile or there is no committed plan in place for that week. |
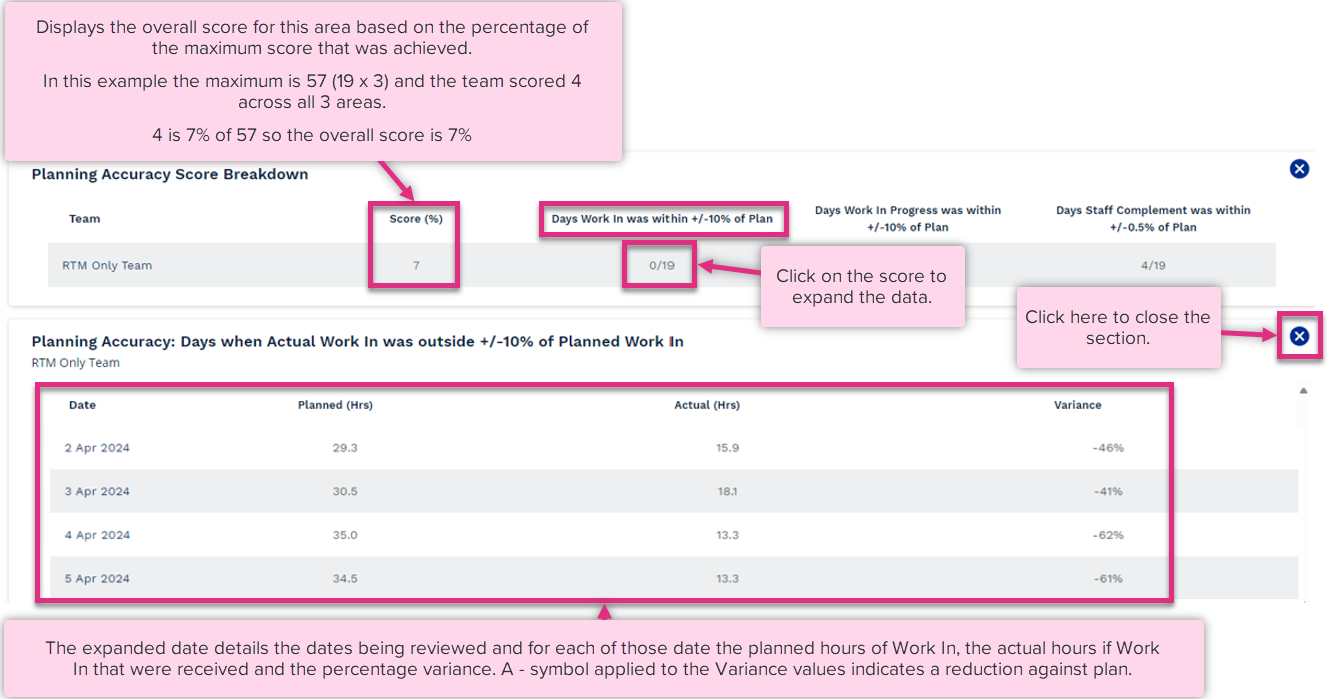
Clicking on each of the scores will expand the data further.
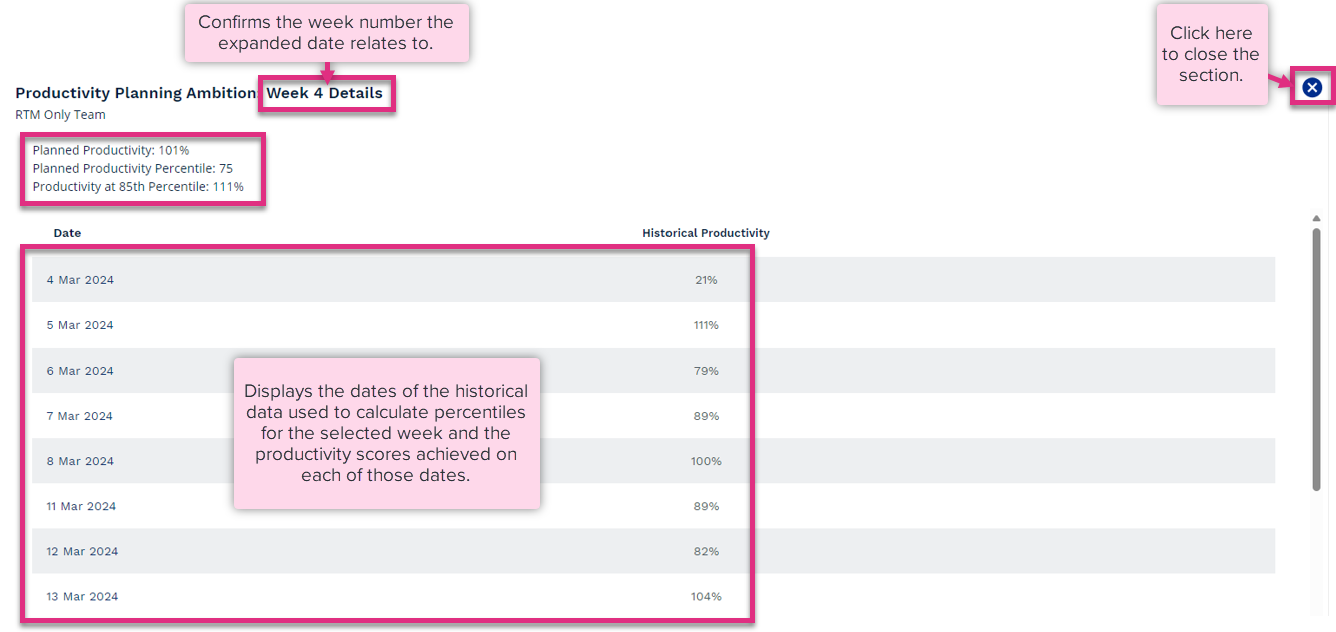
Planned Productivity
Planned Productivity Percentile
Productivity at 85th Percentile
|
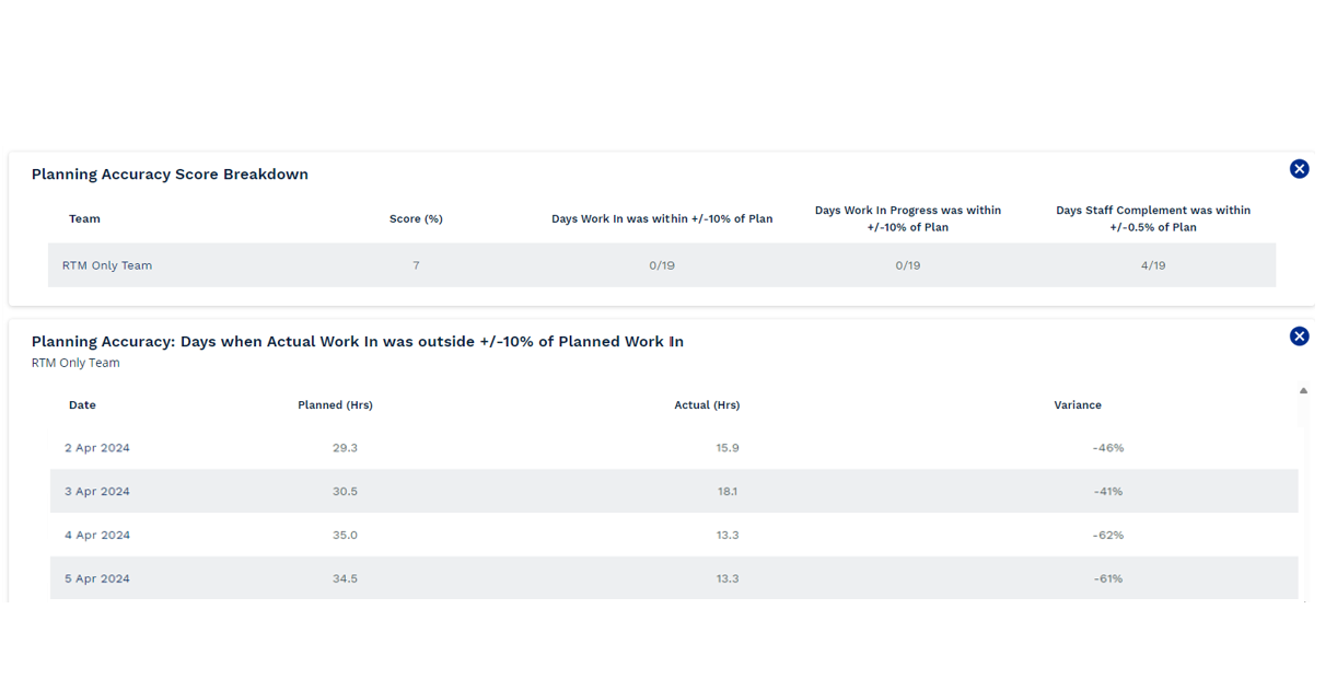
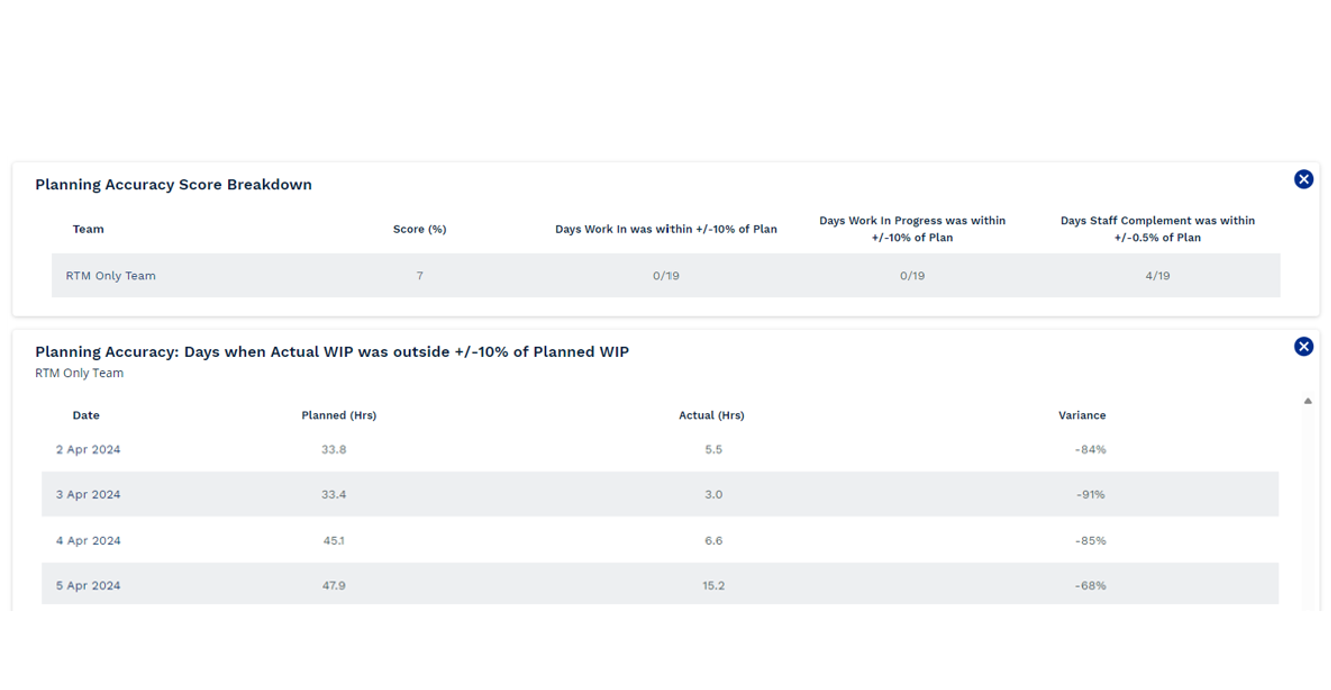
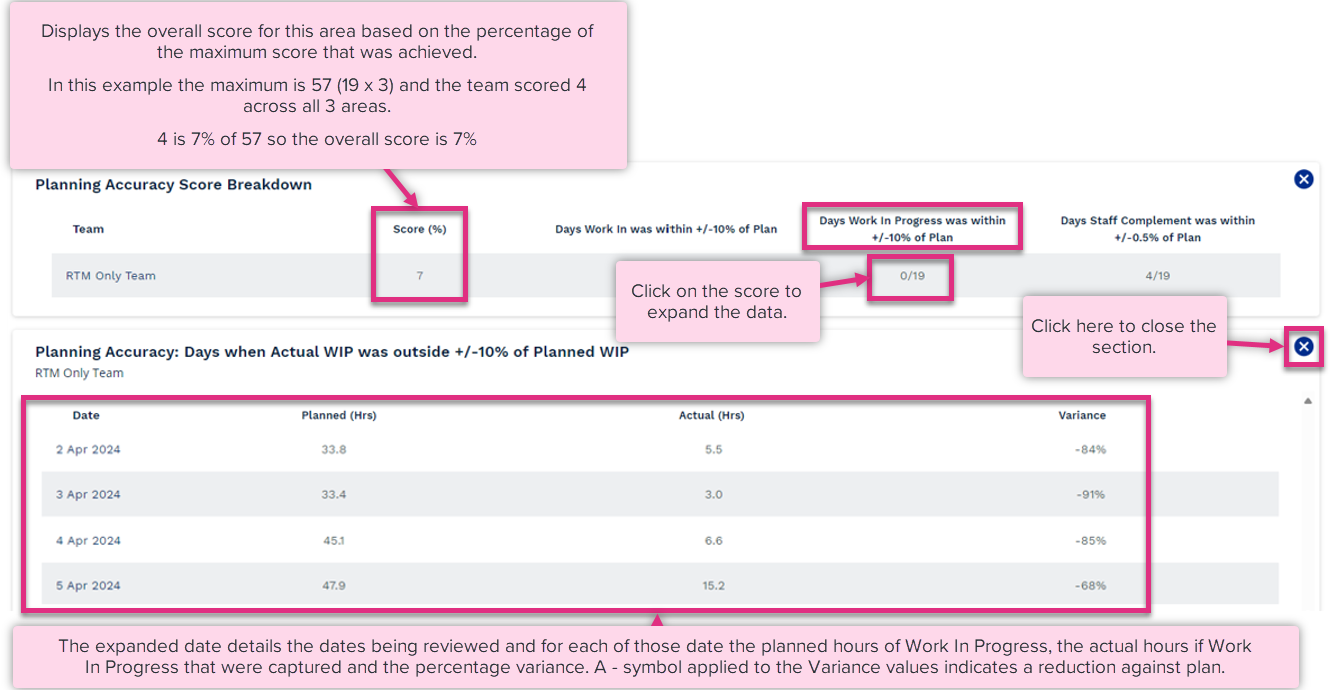
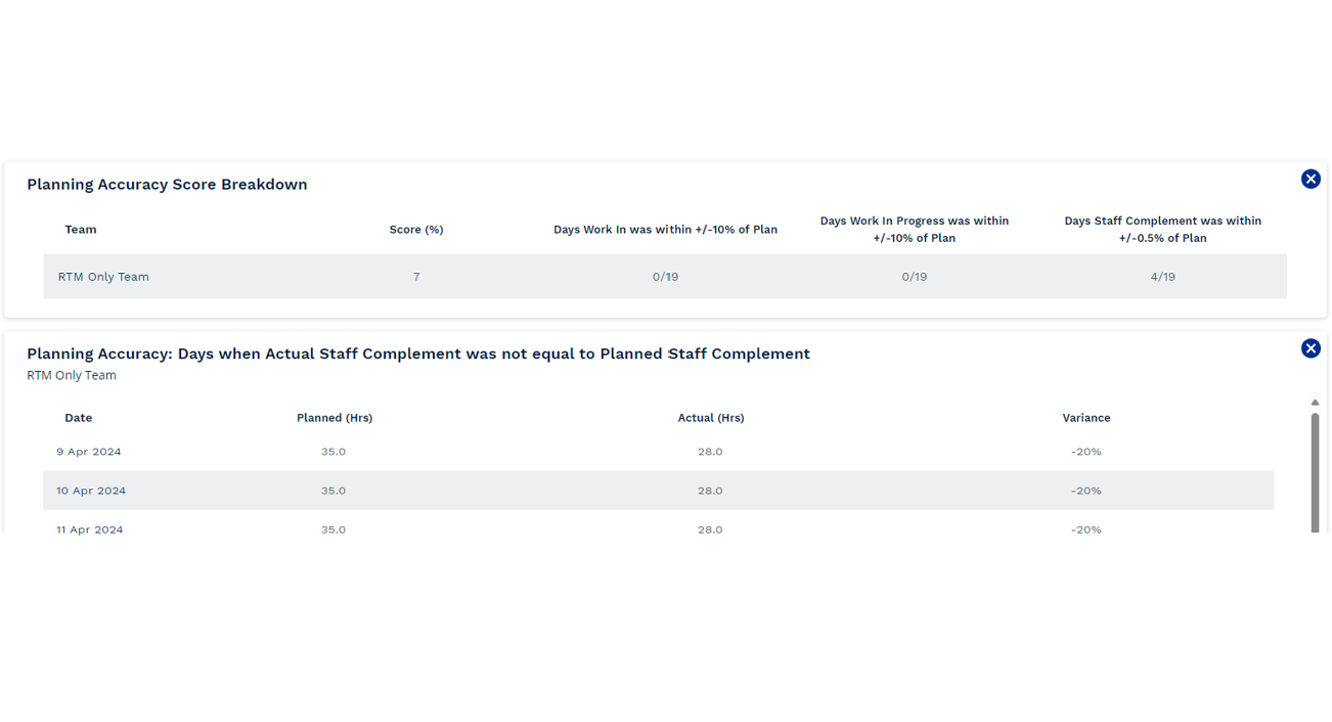
The Planning Accuracy area is indicating whether or not lessons are being learnt and applied as part of the Variance analysis process to improve the accuracy of the capacity plans being built.
Days Work In was within +/- 10% of plan, this section is reviewing the accuracy of forecasting are weekly and daily trends in Work In volumes being recognised and applied to plans. The overall score is based on the how many of the total working days within the 4-week period that actual Work In was within 10% of the planned value.
|
Days Work In Progress was within +/- 10% of Plan, this section is reviewing how realistic the targets set in relation to Work in Progress are. Poor forecasting of Work In and Out will impact the teams ability to deliver on Work In Progress targets and risk failure of SLA’s. The overall score is based on the how many of the total working days within the 4-week period that actual Work In Progress was within 10% of the planned value.
|
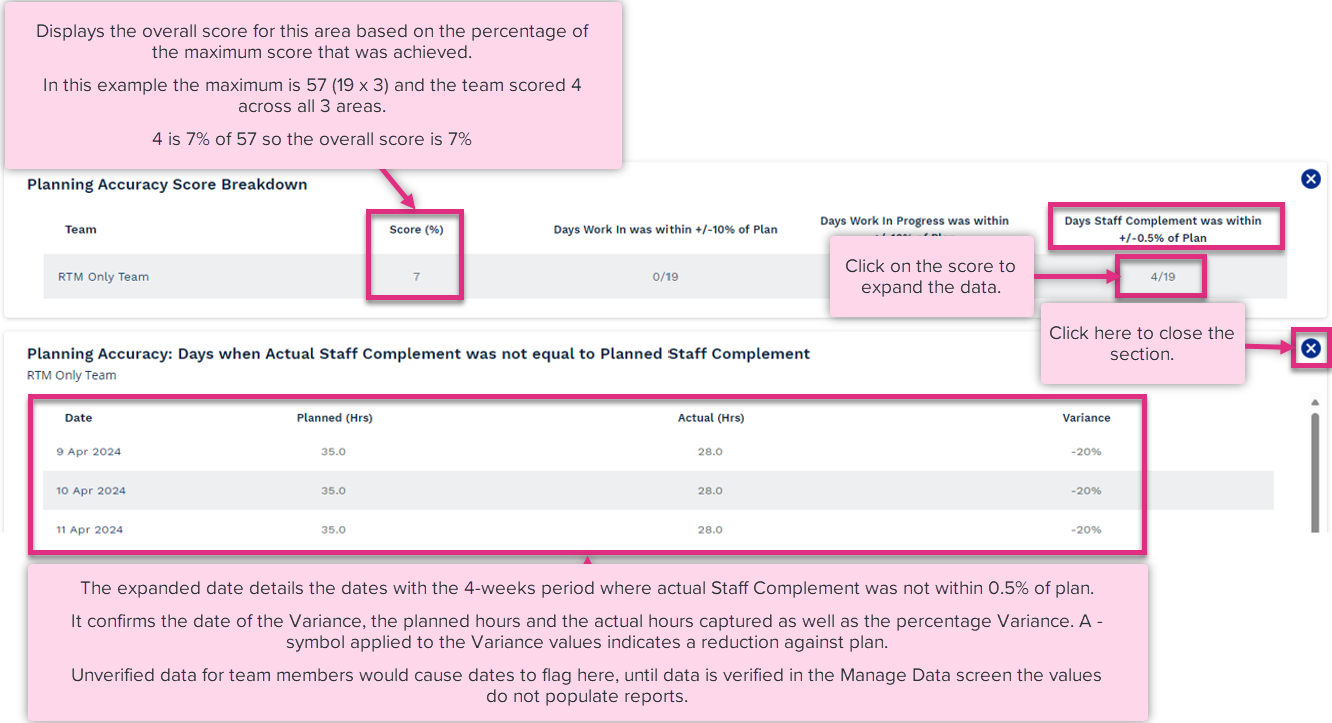
Days Staff Complement was within +/- 0.5% of Plan, this section is reviewing how accurately the base level of resource data is being planned. Staff Complement represents the contracted hours of all team members linked to a team. The overall score is based on the how many of the total working days within the 4-week period that actual Staff Complement was within 0.5% of the planned value.
![]()
|
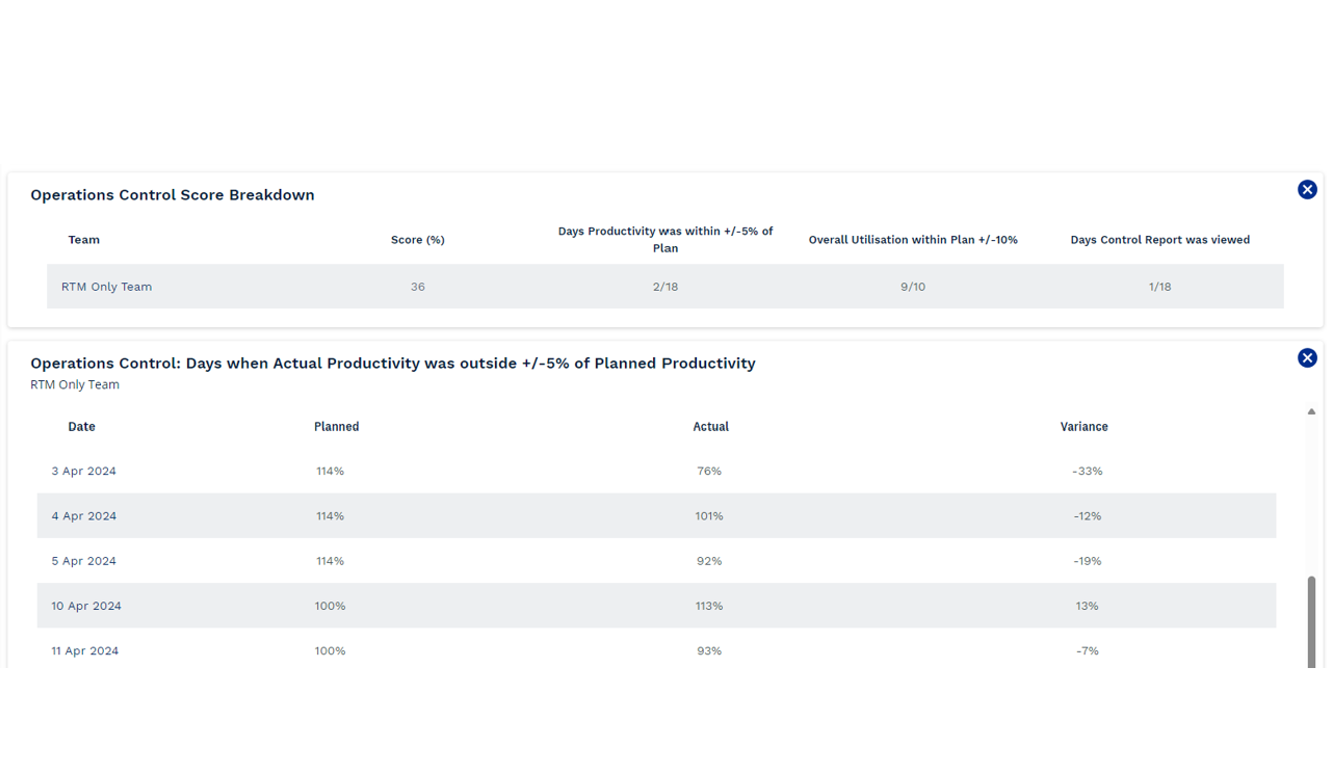
The Operations Control area is assessing how well the daily control process is being completed. Are managers identifying when things are going off track and taking corrective action to remain on track with their plan.
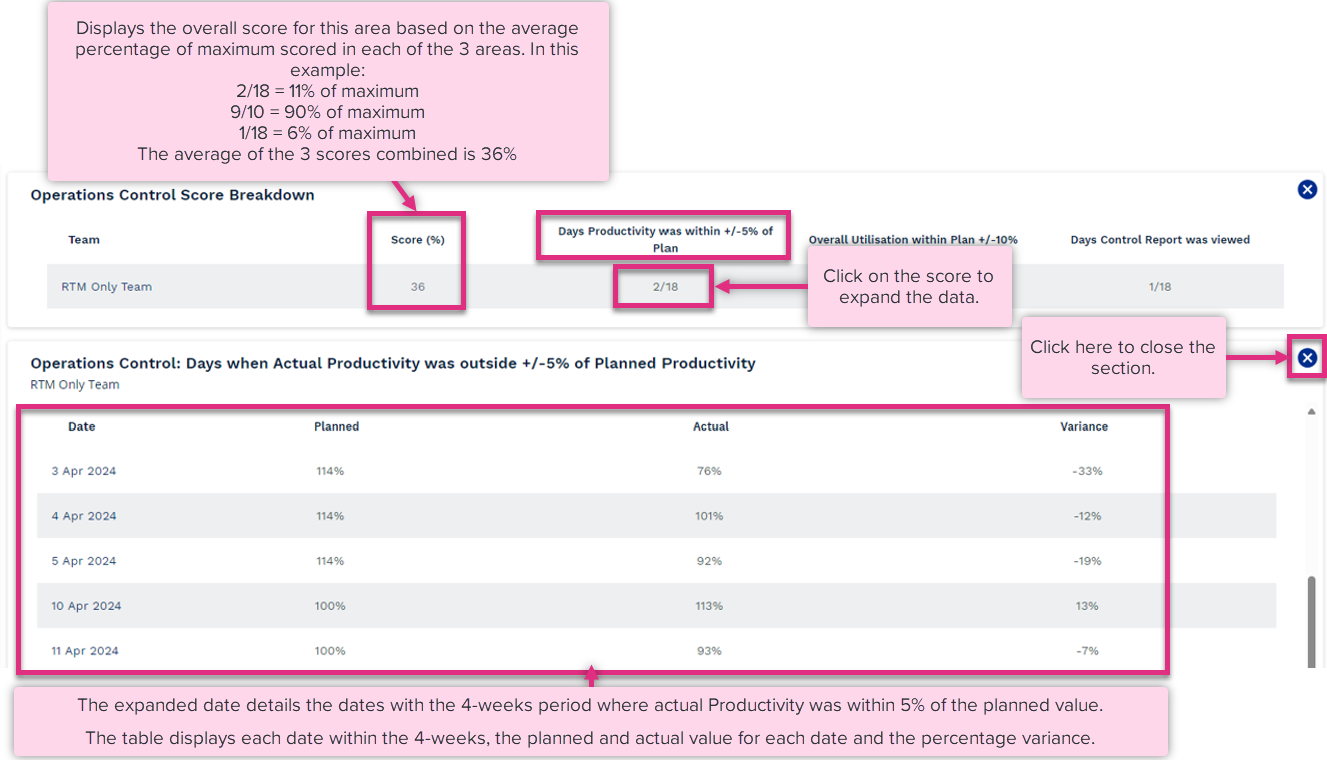
Days Productivity was +/- 5% of Plan, this section is reviewing how the team are performing against planned Productivity targets. The overall score is based on the how many of the total working days within the 4-week period that the team achieved a level of productivity within 5% of plan. For example, a score of 18/20 means that there were 2 days out of the maximum 20 where there were team did not achieve a productivity score within 5% of plan.
|
Overall Utilisation within Plan +/- 10%, this section is looking at Diverted activities and how close the actual values captured are to plan across the 4-weeks as a whole. The overall score is based on how close to planned Utilisation actual was with 1 point lost for every 1 percent variance. For example, a score of 9/10 means actual utilisation was 1% higher or lower than planned so 1 point was lost from a maximum of 10 points.
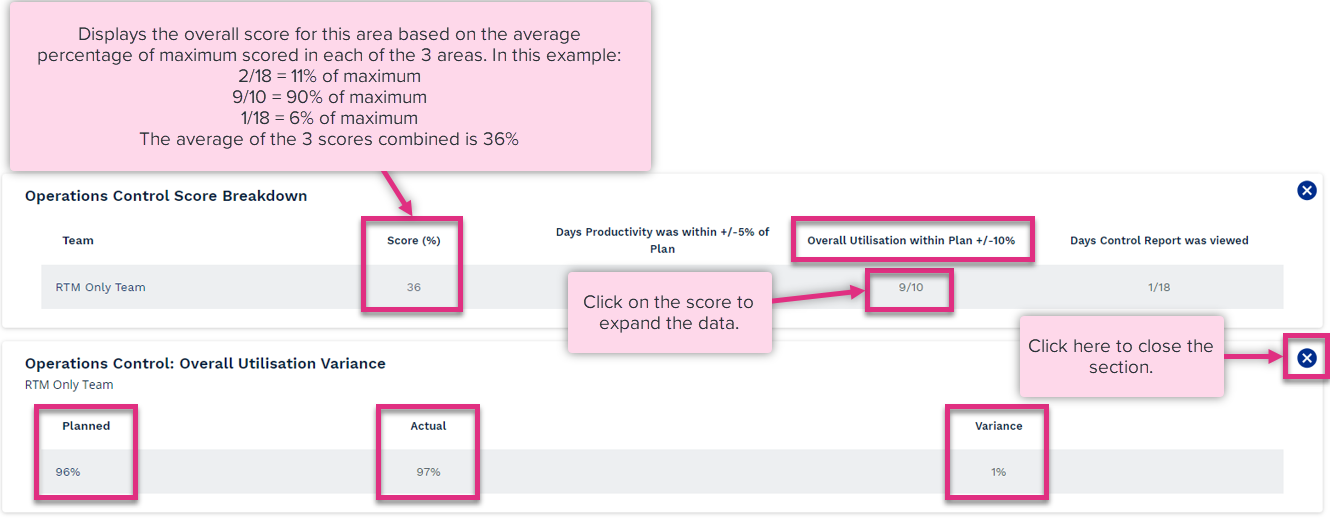
Planned
Actual
Variance
|
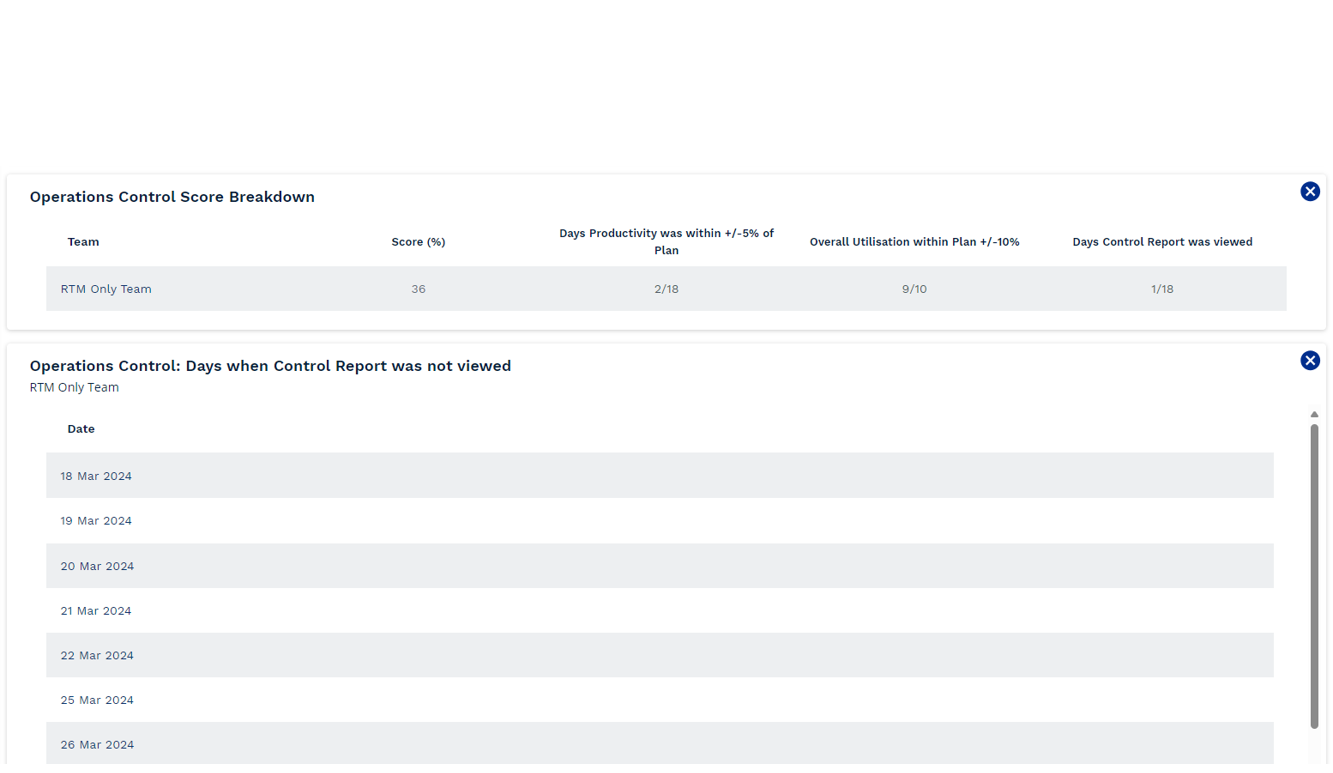
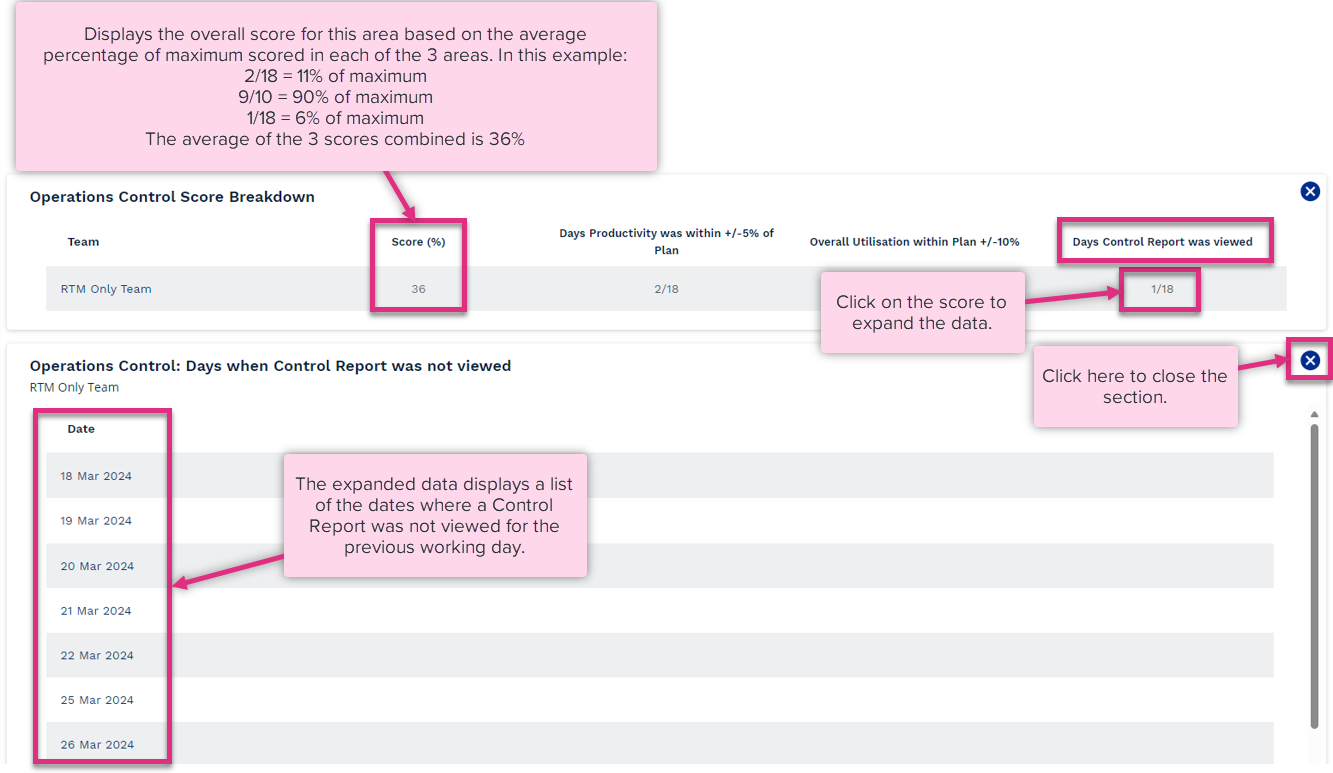
Days Control Report was viewed, this section is reviewing how well the daily control process is being completed. To recognise and address significant variations to plan on a daily basis a Control Report needs to be viewed. The overall score is showing on the how many of the total working days within the 4-week period a Control Report was viewed that included the previous working day. Please note that the Rigour Report awards points when a Control Report is run to review the previous days performance against Plan. Therefore, you will not receive a point for viewing the Control Report for the current day.
|
When running the Rigour Indicator Report at a level of the hierarchy higher than team the Summary table will display the scores for all child workgroups. This allows for comparison between teams within a business unit and identification of teams that are practising AOM well and those who might need more support. The data displayed is the same as in the team level report and can be expanded in the same way as when viewing the report at a team level.
| For more information on... | |
|---|---|
| Rigour Indicators Video | Rigour Indicators Video |
|
Calculations |
See Key Equations |
| Frequently Asked Questions | See FAQs |
| Video Library | See Video Library |


