Production report
Overview
The Production report shows you the actual values recorded for workload, resources, and performance metrics for any period, so that you can identify trends or changes across time. You can look at this data across multiple levels of the hierarchy using a variety of time horizons.
To run a Production report, select the Production Report tile from the Reports screen and then set your parameters to specify how and what data you would like to view.
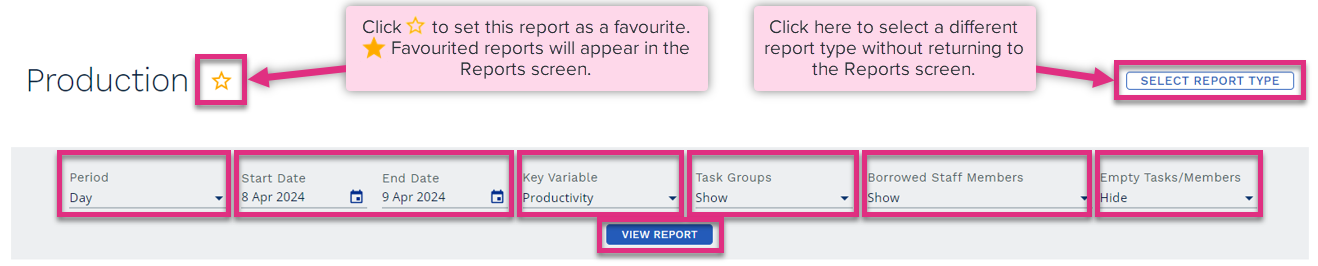
Period
Start / End Date
Key Variable
Task Groups
Borrowed Staff Members
Empty Tasks / Members
View Report
|

|
Please note! Only data that has been verified in the Manage Data screen will appear in this report. |
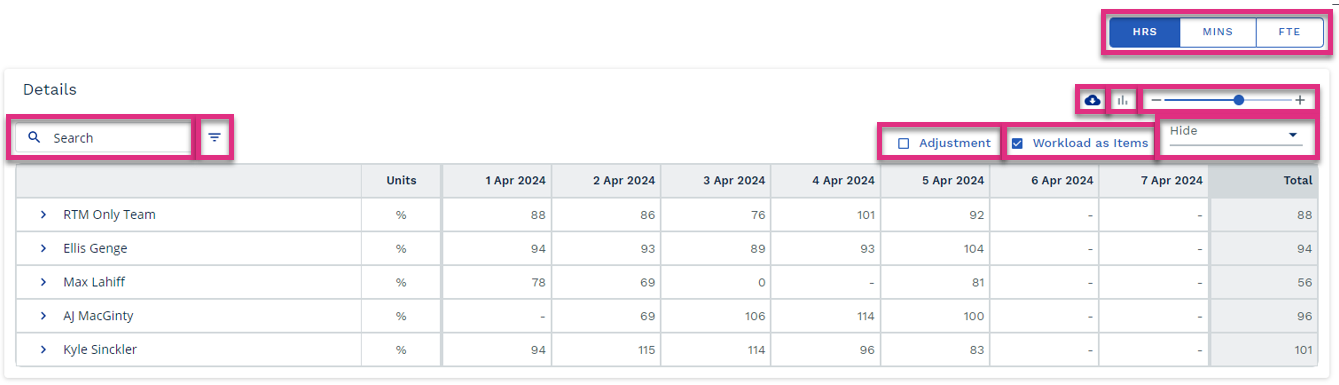
Search
|
|||||||||||
|
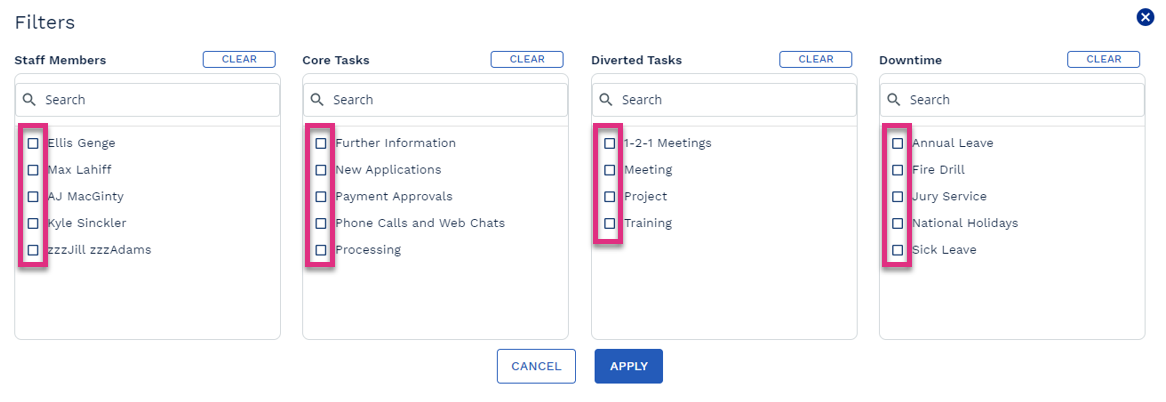
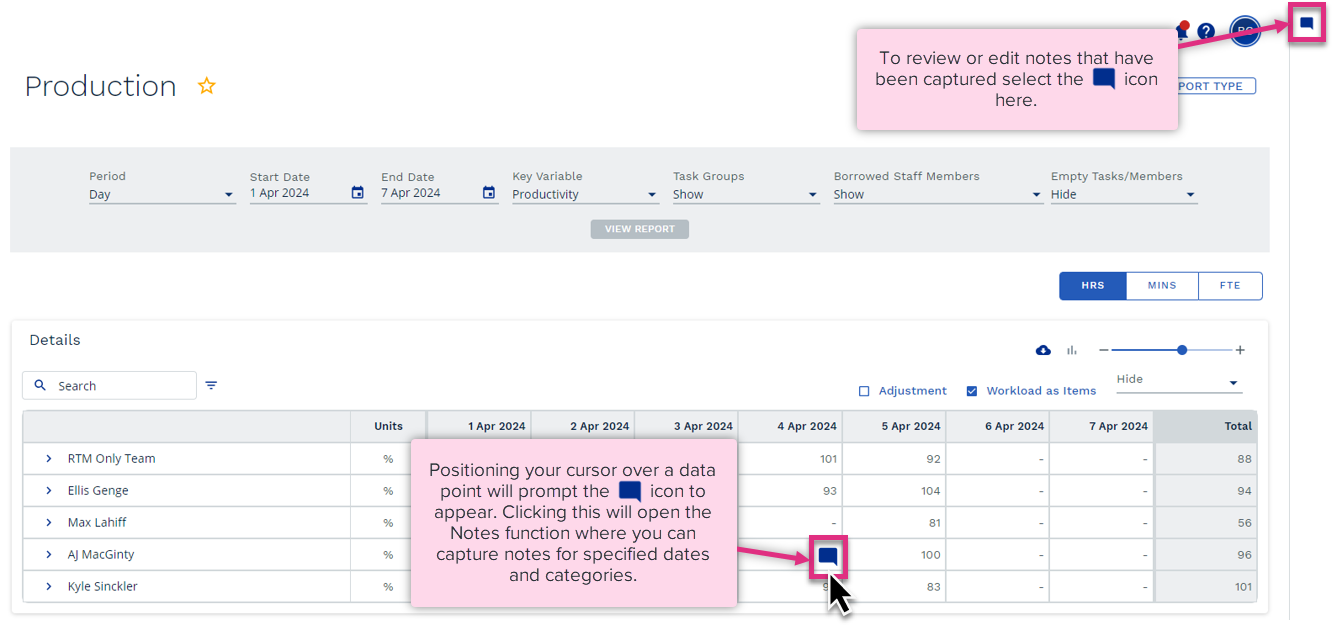
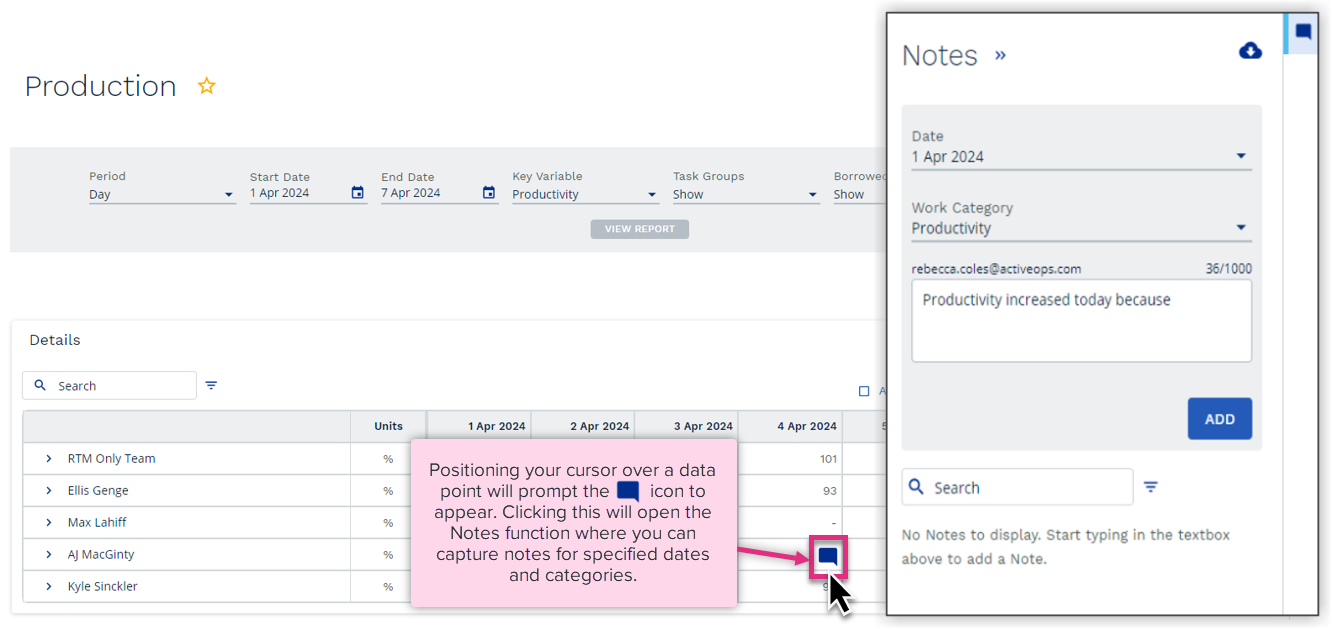
You can filter the report to only display specific team members, tasks or activities by clicking on the
Select the data you would like to be included in the report by clicking on the checkbox next to the team member, task or activity name and click Apply. If filters are selected the Filter icon will display a red dot with the number of filters applied Please note that filtering data will exclude unselected data from key calculations such as Productivity and Work In, Work Out and WIP. |


|
|
|
|
Column Width
|
Click and hold on the slider to resize columns |
Report Intervals
| You can view your data in hours, minutes or FTE by selecting the required unit here. |
Adjustment
|
Selecting this checkbox will cause any adjustments made to calculated Work In or WIP values in the manage data screen to be displayed in the report. |
Workload as Items
|
Selecting this checkbox will display Work In, Work Out and WIP as items at the task level. Unchecking this box will display the data in the unit of time based on items multiplied by standard time. |
Hide
|
This option allows you to exclude dates from the report. Click on the drop-down menu and select the dates you would like to exclude by selecting the checkbox next to the relevant date. |
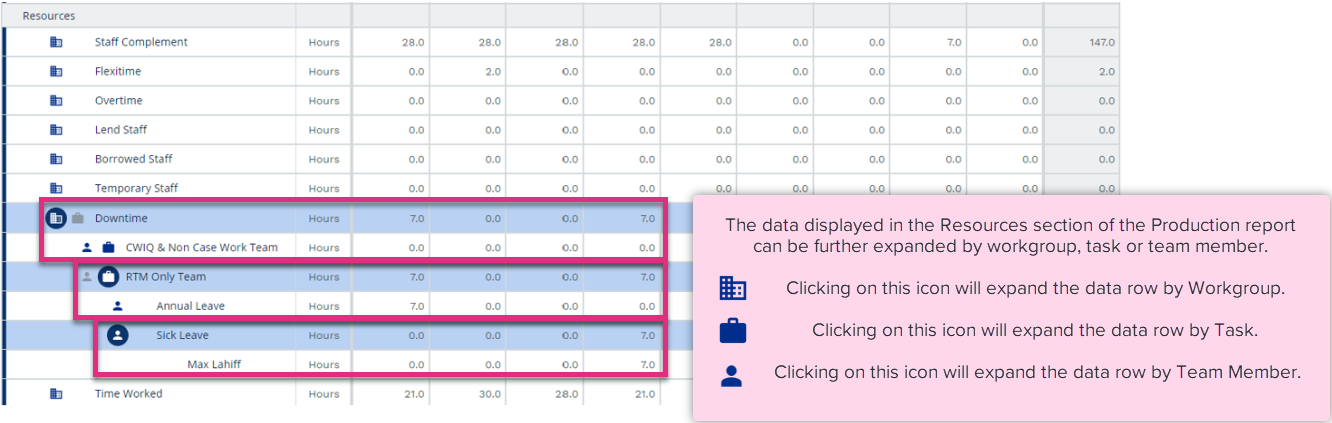
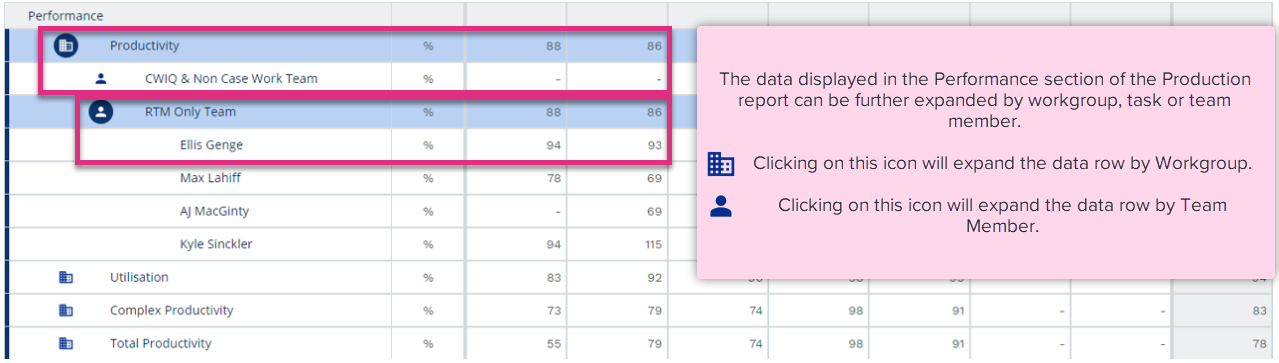
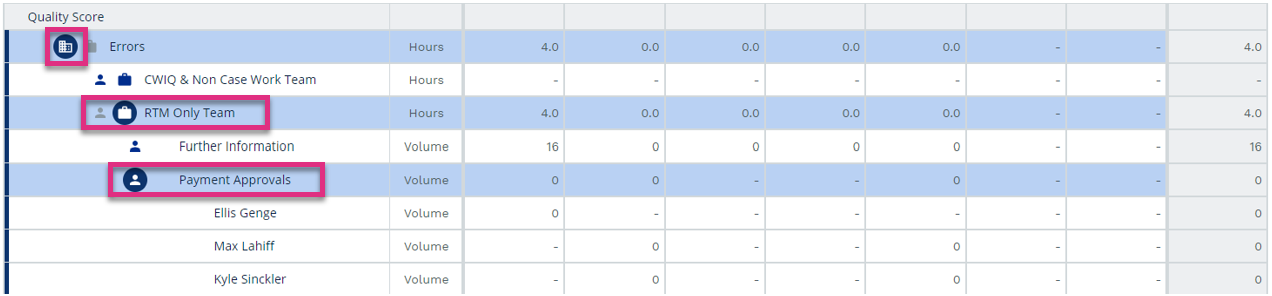
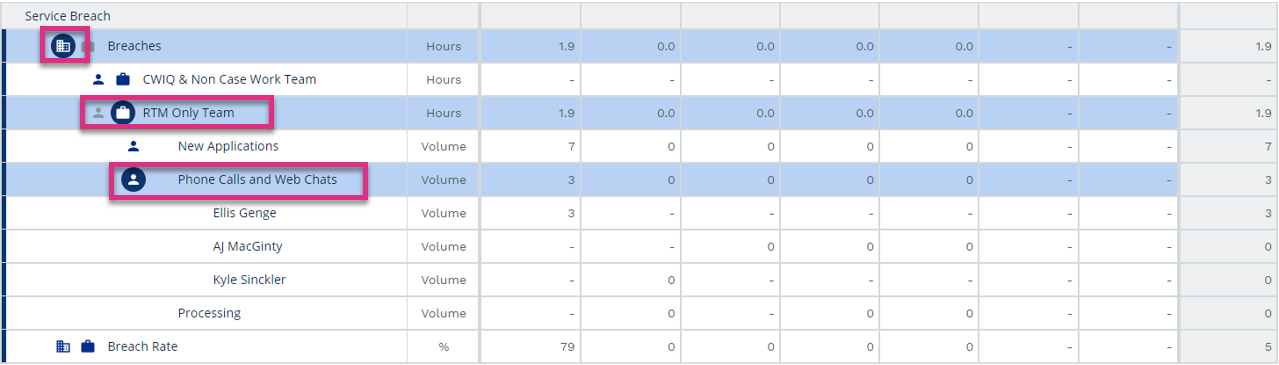
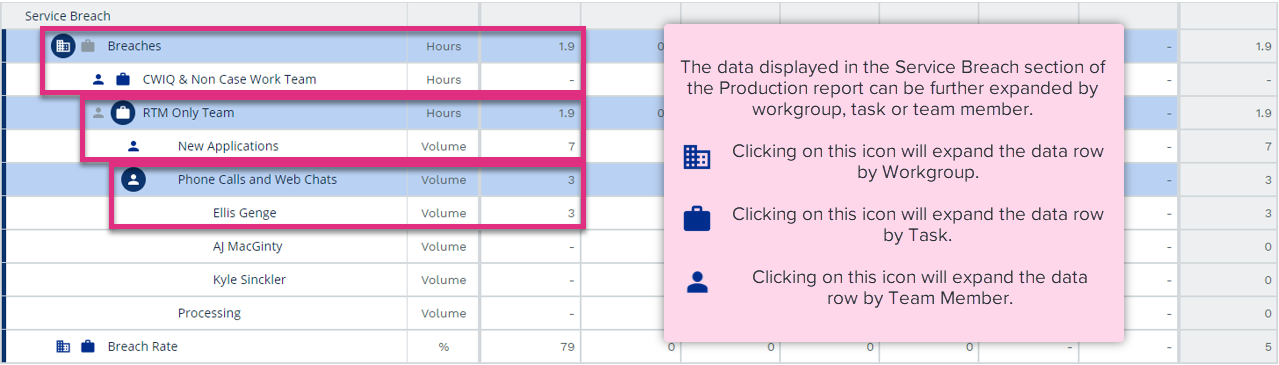
The report will display data for the level of the hierarchy at which it was run and then any child data beneath it.
For example, if you run this report at a team level you will see the team values followed by the team members. If you run the report at a department level, you will see the Department values followed by the teams within that department.
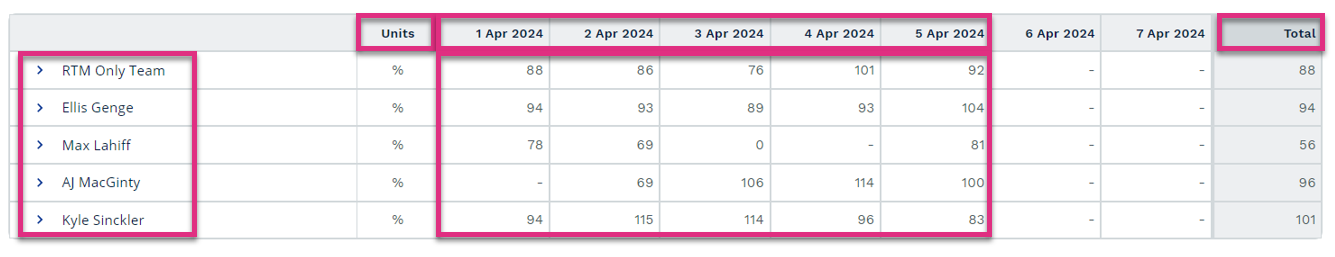
Workgroup / Team Member Name
Units
Plan Unit Date(s)
Key Variable Data
Total
|
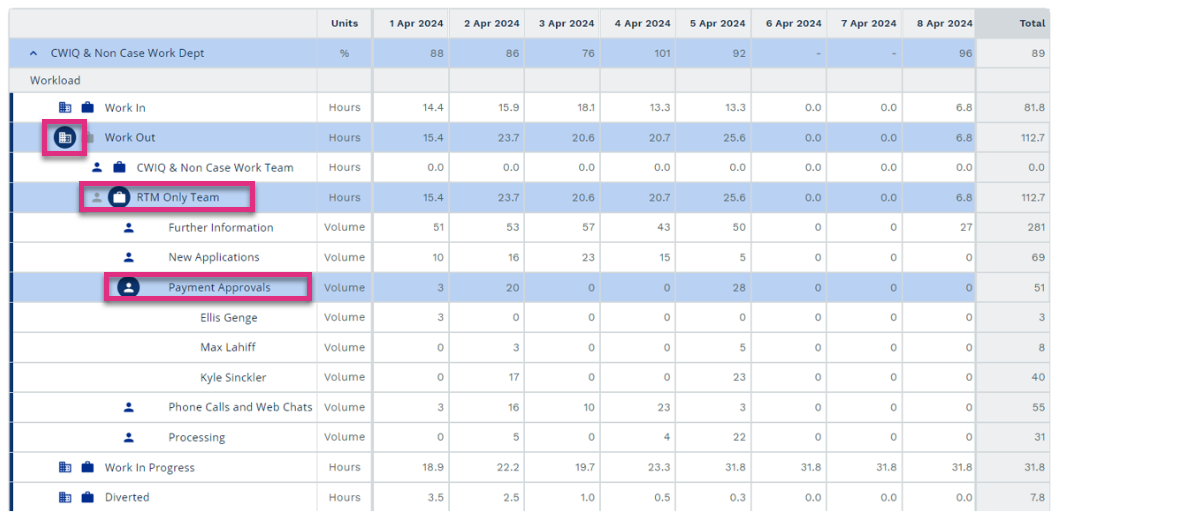
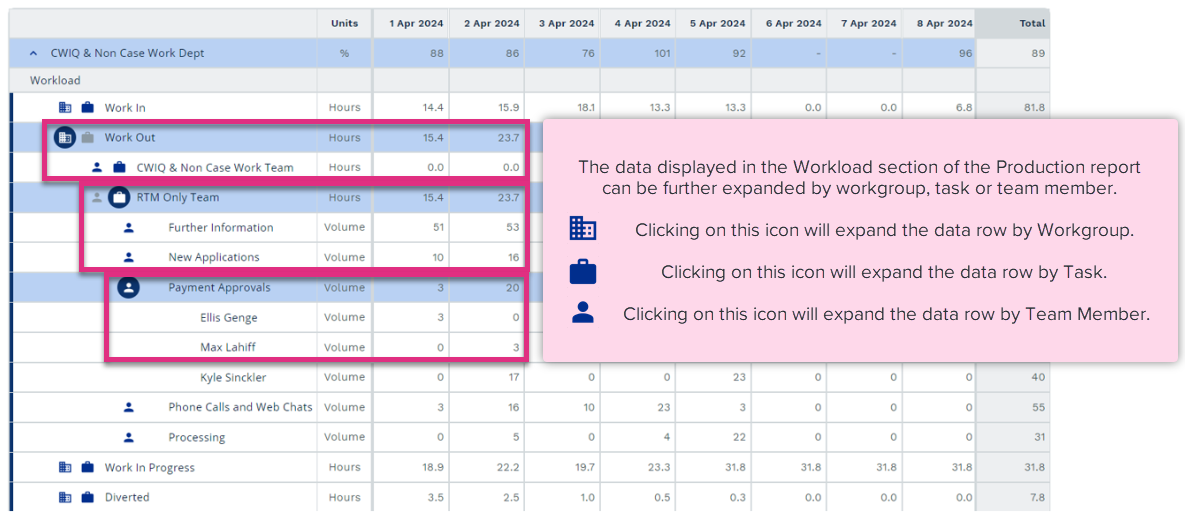
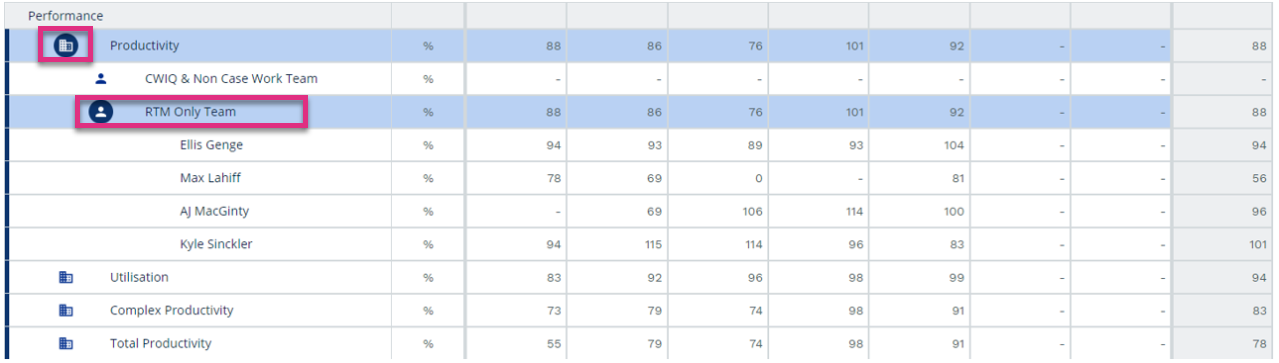
 icon to expand a row and view the next level of detail.
When you run your report the Key Variable that you selected when setting report parameters will display at the highest level. You can then drill-down into each row of data for more detail.
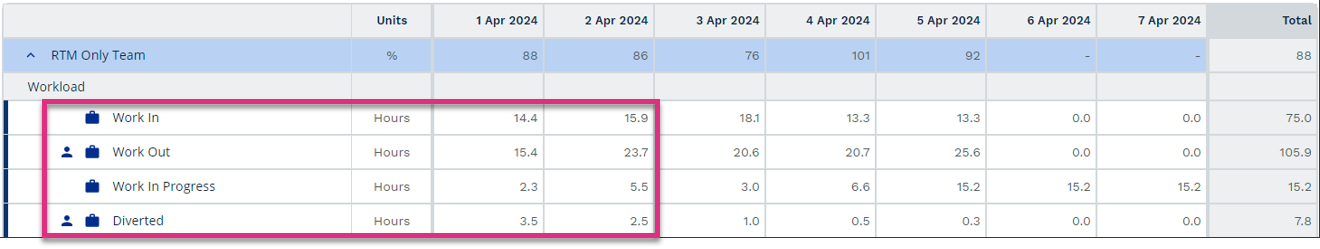
Work In
Work Out
Work In Progress
Diverted
|
|
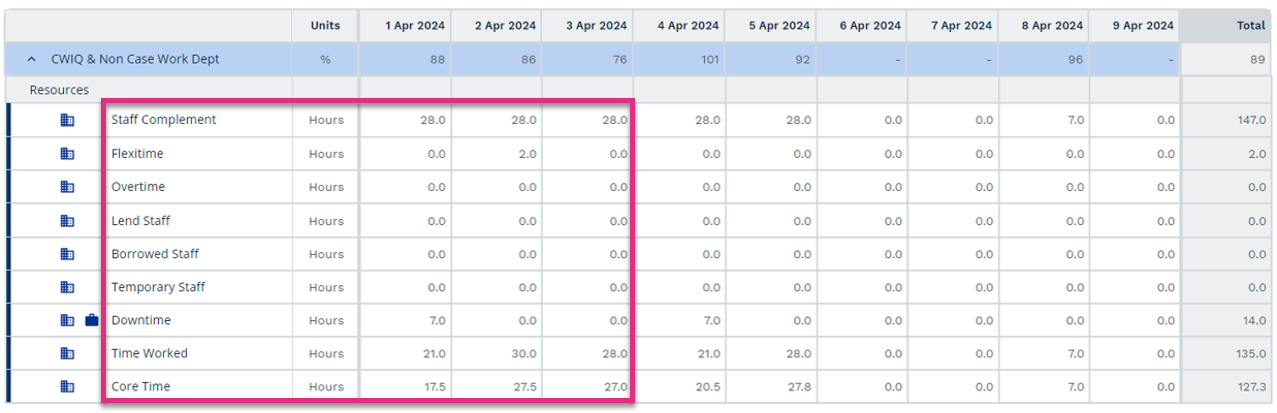
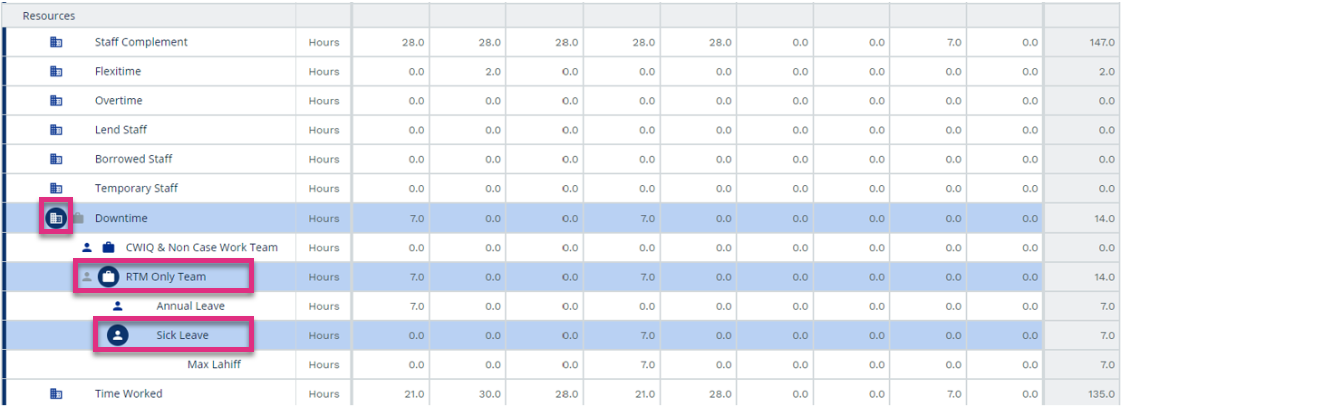
Staff Complement
Flexitime
Overtime
Lend Staff
Borrowed Staff
Temporary Staff
Downtime
Time Worked
Core Time
|
|
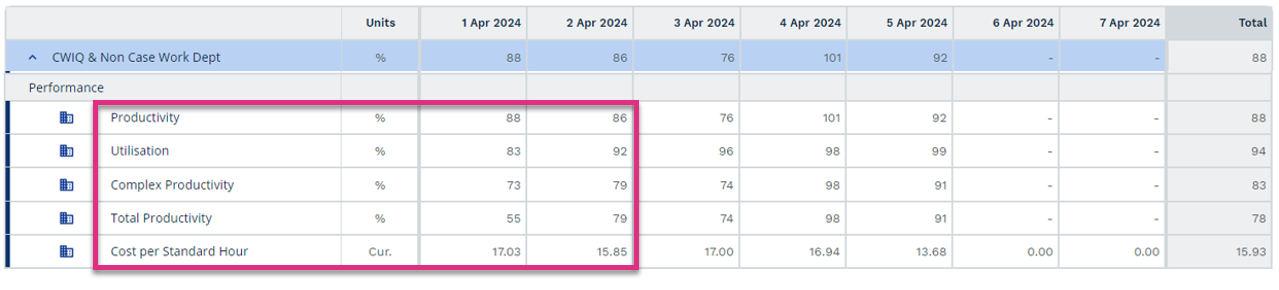
Productivity
Utilisation
Complex Productivity
Total Productivity
Cost per Standard Hour
|
|
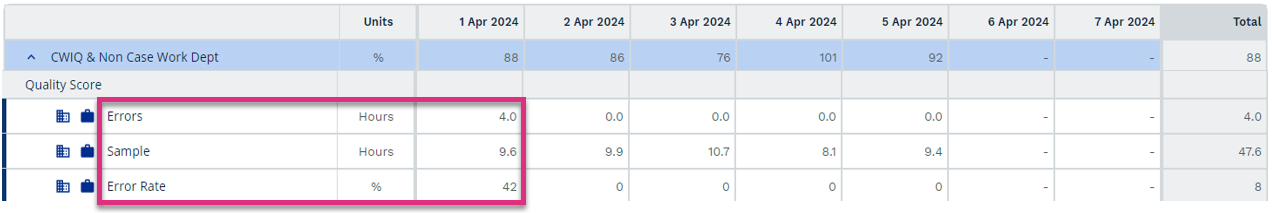
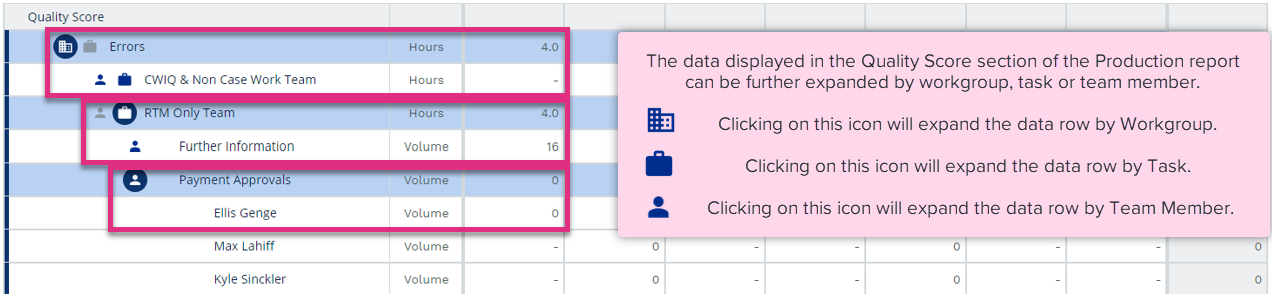
Errors
Sample
Error Rate
|
|
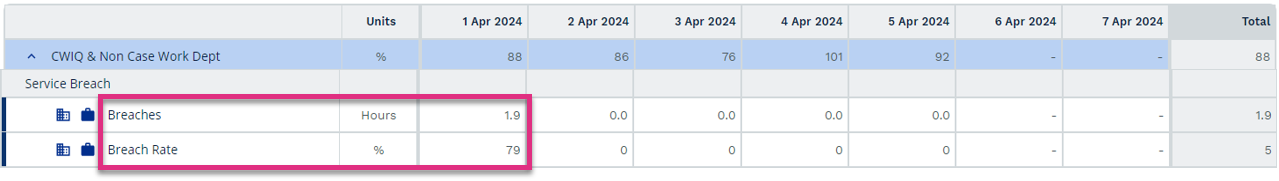
Breaches
Breach Rate
|
|
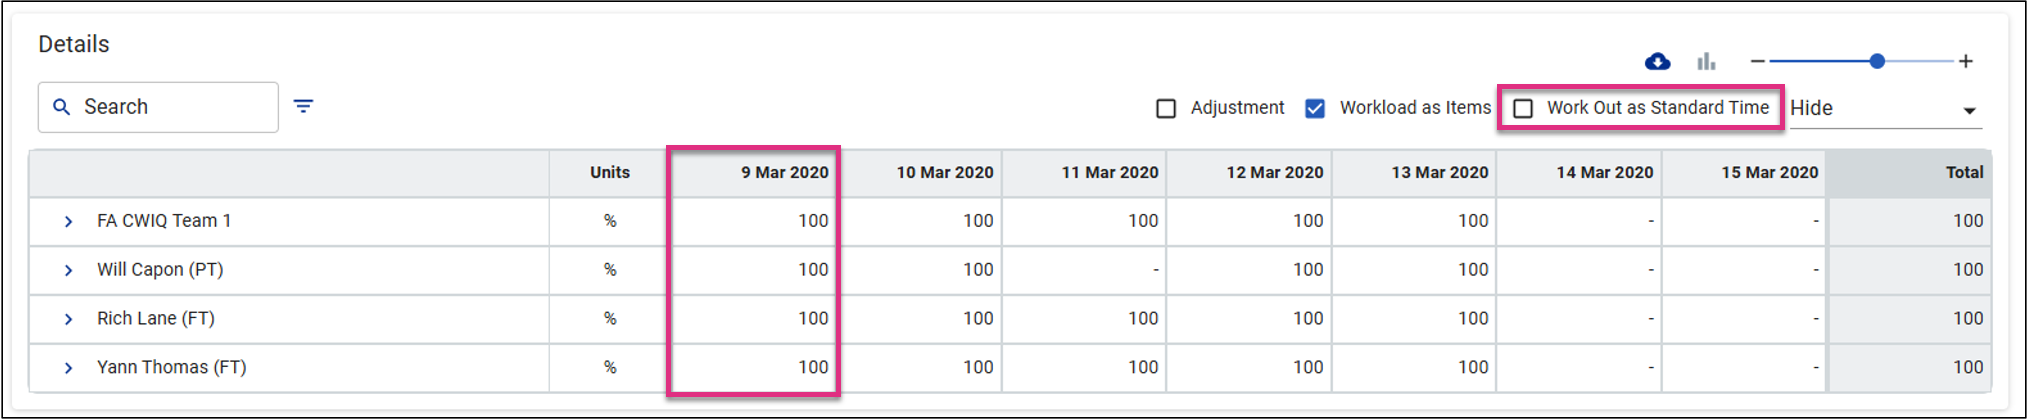
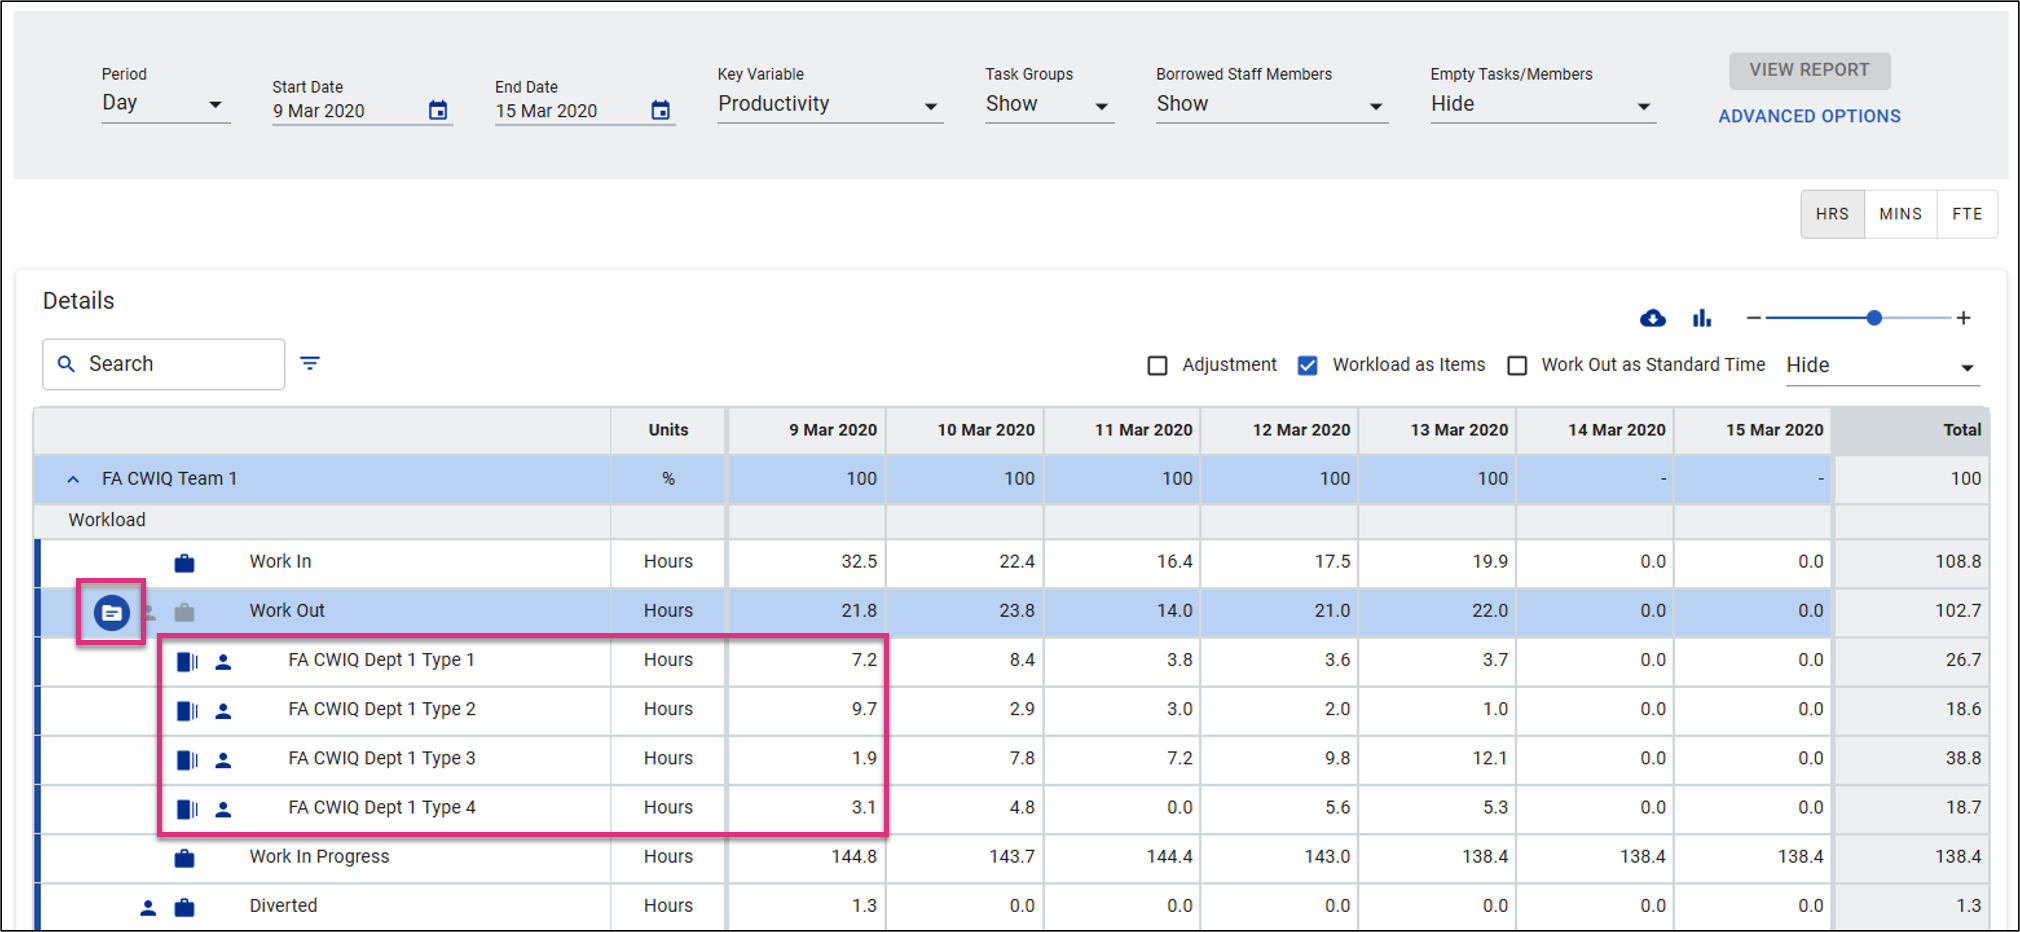
If you are running a Production Report for a CaseworkiQ enabled workgroup you will see some additional options.
The first is the Work Out as Standard Time check box that will be available if you are running the report at a team level. This allows you to view Work Out and Productivity based on either items of core tasks completed multiplied by the standard time or actual time captured in the Case Worklog.
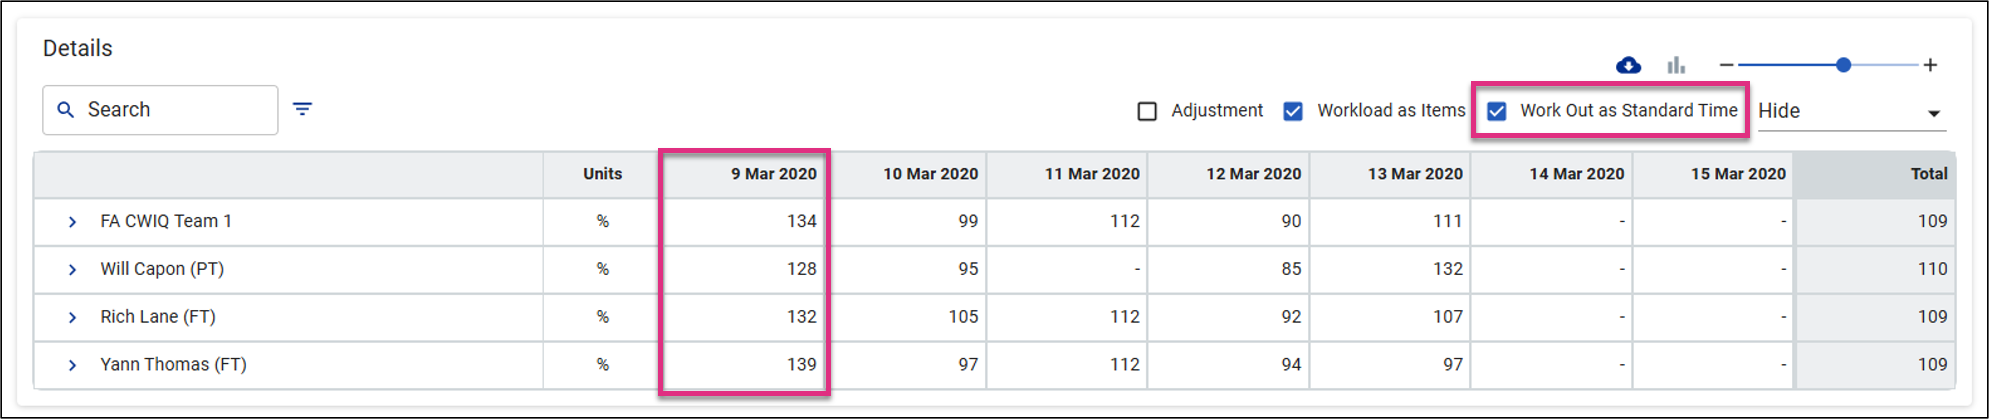
If you are viewing Productivity based on the actual time captured in the Case worklog a score of 100% indicates that an individual’s core time and work out match. If productivity is not 100% this could indicate a data capture error.
You will also have the ability to expand Work Out by Case Type using the  icon.
icon.
You can then further expand by Case Stage using the ![]() icon.
icon.
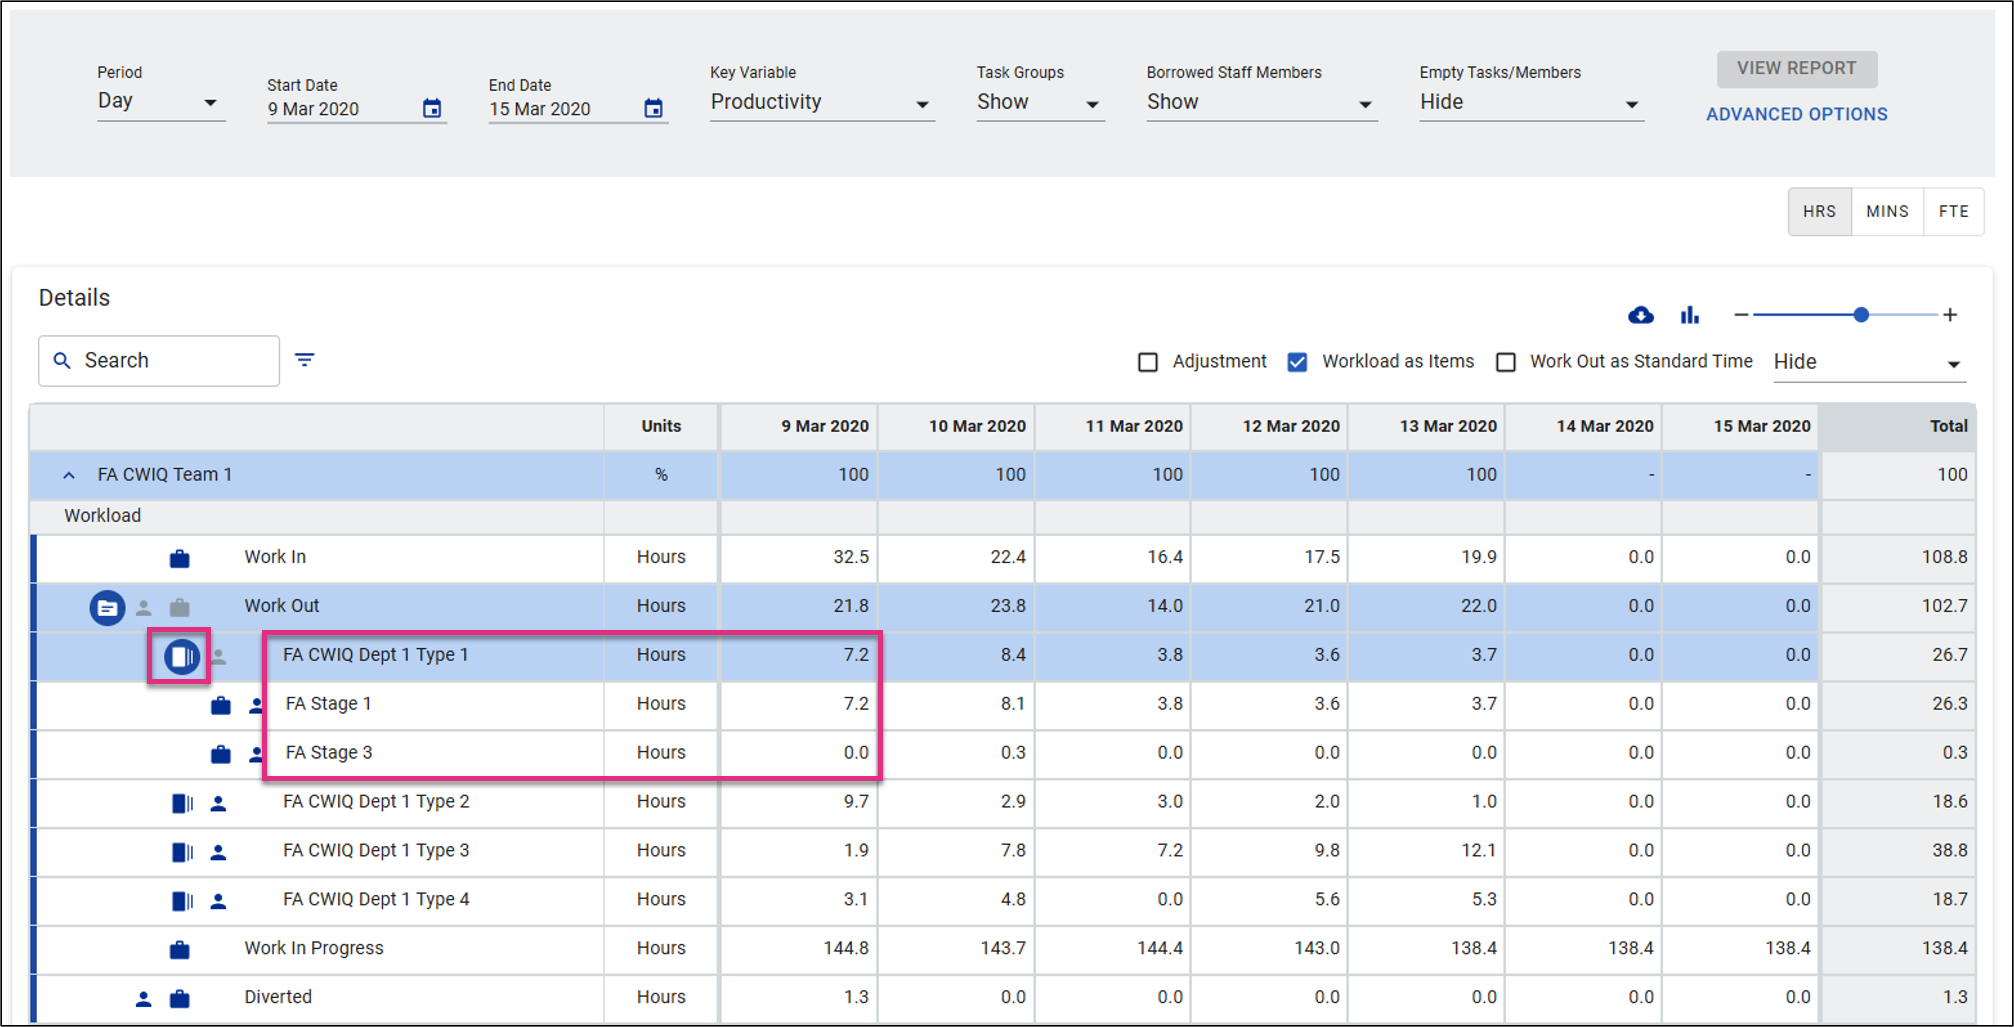
The time values displayed will either be based on the items of core tasks completed multiplied by the standard time or the actual time captured in the Case Worklog dependent on the option selected.
| For more information on... | |
|---|---|
|
Calculations |
See Key Equations |
| Frequently Asked Questions | See FAQs |
| Notes | See Notes |


