Control Report
Overview
This report is intended to support delivery of your capacity plans, it shows you how your teams and departments are progressing against their plans so that you can make informed decisions about what they need to do today, this week or this month to deliver on their plans. You can also use it to analyse variances from plan retrospectively to understand what caused any significant variances, the impact they had on the team and the actions that were taken to minimise that impact. This analysis can then inform future plans.
Because this report is intended to support delivery of plans you would typically only run it for a period of time that you have a balance and committed plan in place for.
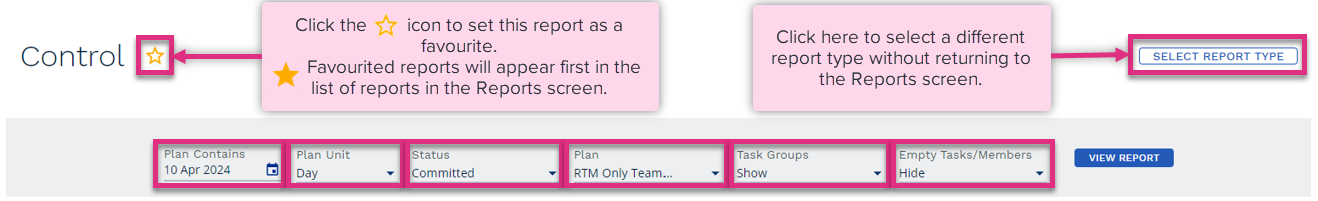
Plan Contains
Plan Unit
Status
Plan
Tasks Groups
Empty Tasks/Members
View Report
|
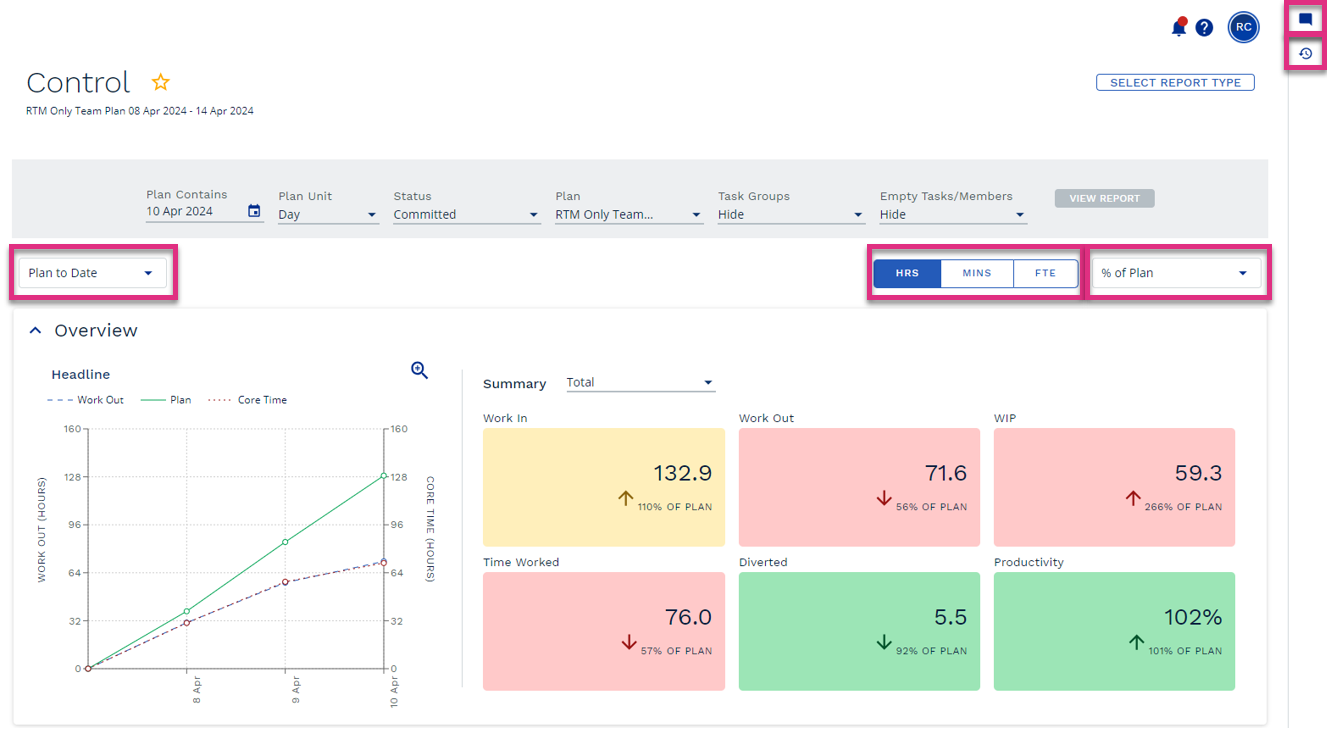
Plan to Date
Report Intervals
% of Plan
|

|
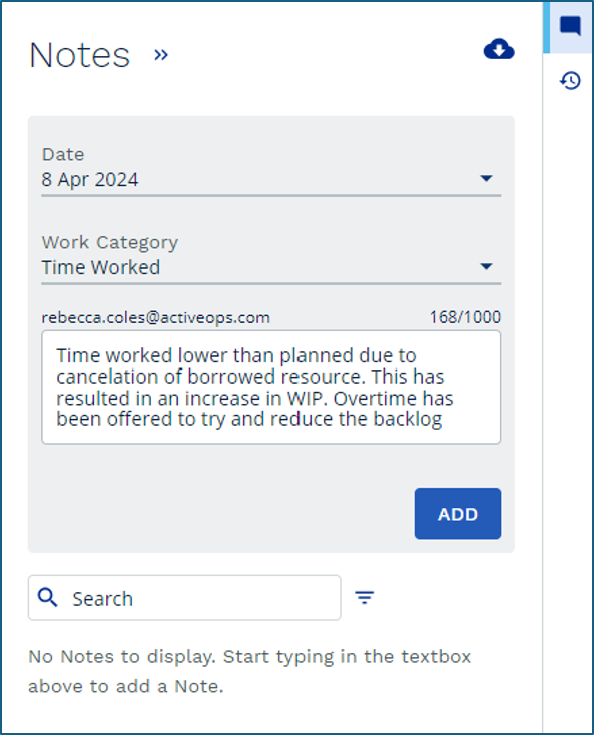
You can add notes to specific dates and categories or the plan as a whole by clicking on the
|

|
Clicking the Activity Log Notes are automatically created in the Loading Board when a value is updated during the Load stage on the Balance grid. Each Note contains details of the changes made that you could refer to here as a reminder of the actions that were agreed and need to be delivered as part of the commitment to deliver to plan.
These commitments can be commented on or marked as resolved by clicking on the |
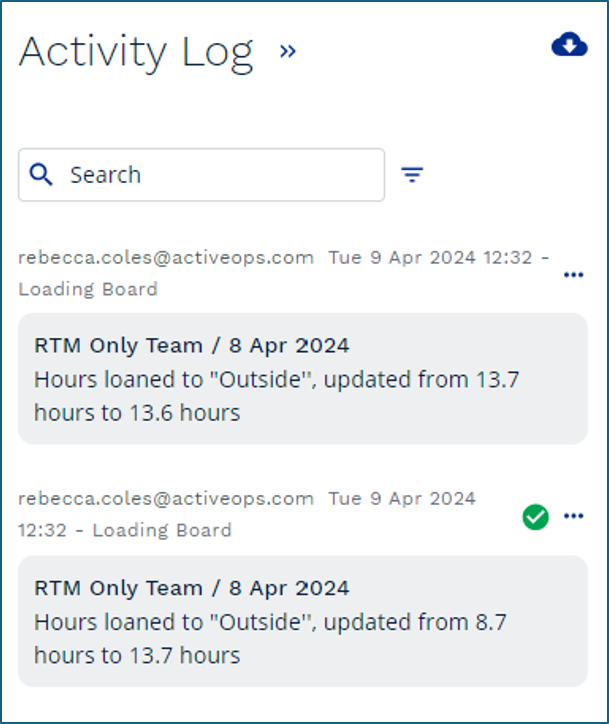
 icon next to the relevant action.
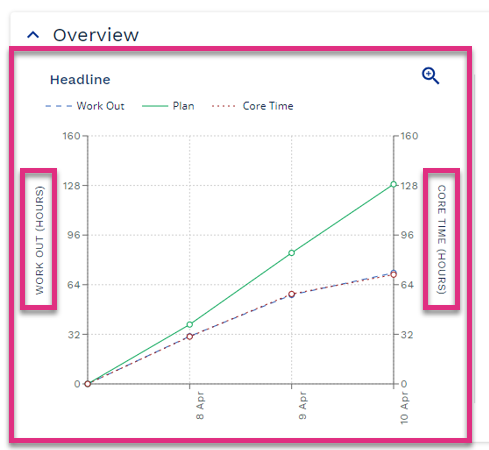
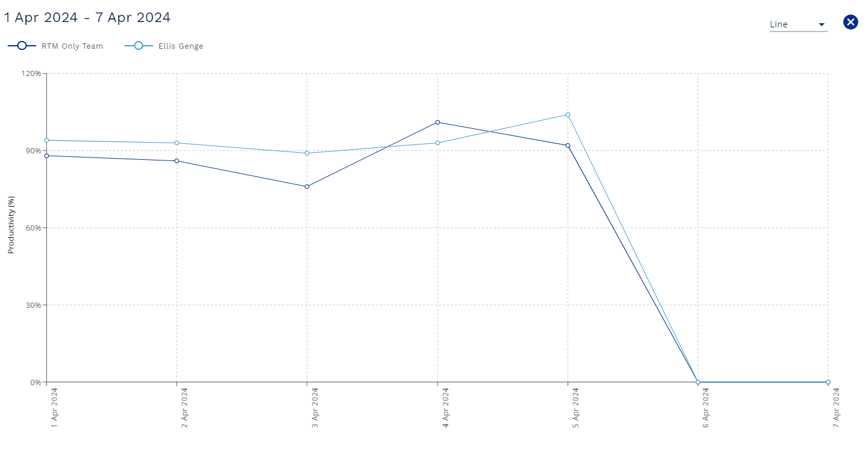
This chart illustrates the Work Out that has been completed and the Core Time used compared to what you planned. This provides a view of how the workgroup are tracking compared to productivity targets.
|

|
The green line is the plan line and illustrates the planned hours of Work Out and the planned hours of Core Time for the whole of the plan period. |

|
The blue line illustrates actual hours of Work Out captured. If this line is positioned above the plan line, then more Work Out than planned has been completed. If it is below, then less Work Out than planned has been completed. | |

|
The red line illustrates the actual hours of Core Time used by the workgroup. If the red line is above the plan line, then more Core Time than planned has been used, if it is below then less Core Time than planned has been used. | |

|
If the Work Out line is below the Core Time line then this means that the workgroup have completed less Core Work with more Core Time and are not achieving the planned level of Productivity. | |
|
If the Work Out line is above the Core Time line then this means that the workgroup have completed more Core Work with less Core Time and are achieving a higher than planned level of Productivity. |
|
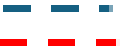
The summary tiles display comparison to plan data (variances) for key metrics these variances are marked as red, amber or green depending on the size of the variance as a percentage of plan. Red – Variance is 20%+ of plan. Amber – Variance is between 10% and 19% of plan. Green - Variance is between 0% and 9% of plan. |
|
Work In
Work Out
WIP
Time Worked
Diverted
Productivity
|
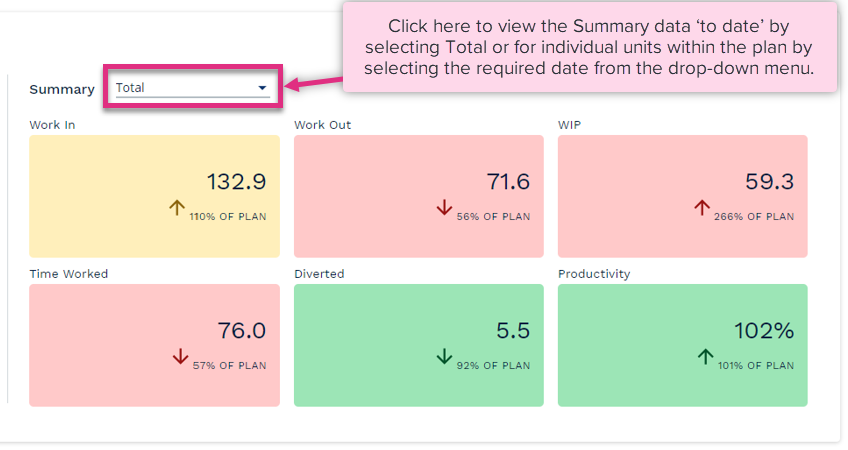
If you run a Control report at a level of the hierarchy higher than a team you will also see a Workgroup Summary table. This illustrates the key metrics for each of the child plans that are feeding into the workgroup you have run the report for. Please note this data is not displayed when the report is run for a team.
Work In
Work Out
WIP
Time Worked
Diverted
Productivity
|
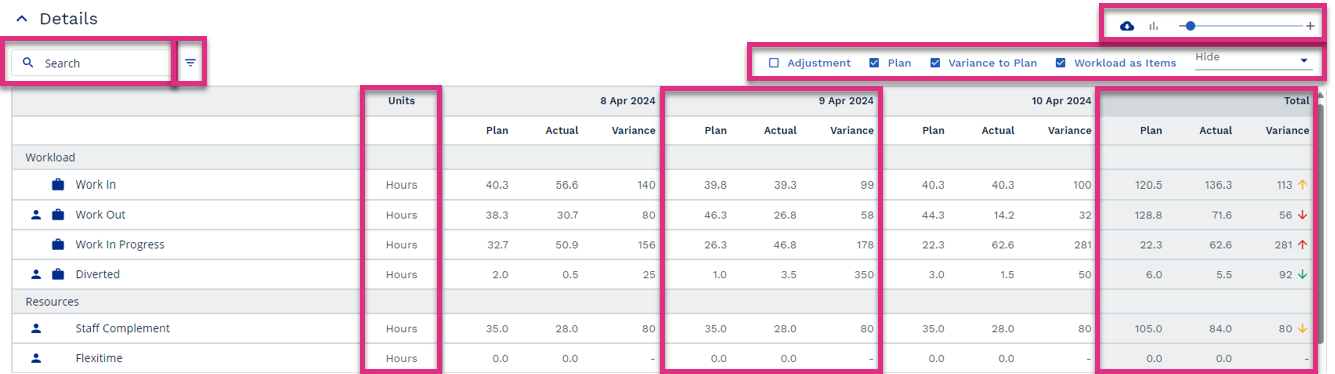
Search
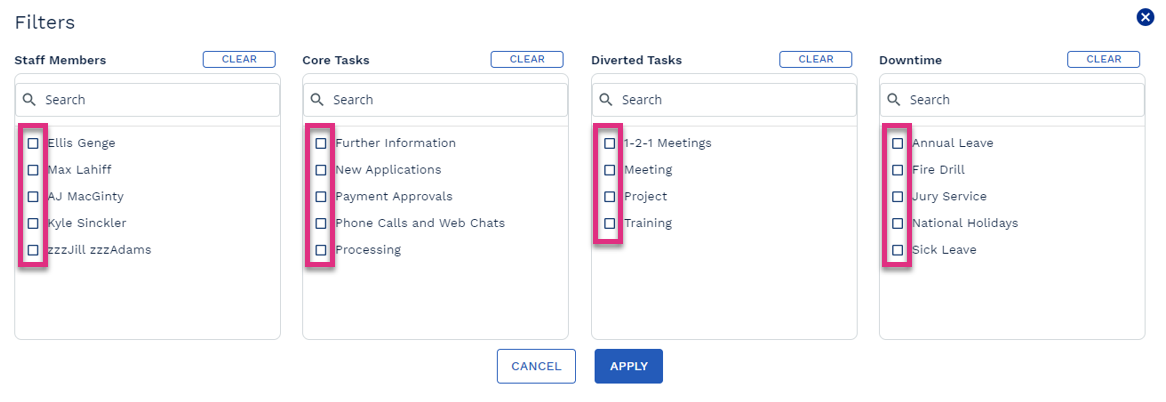
Filters
Hide / Show
Export / Graph / Resize
Units
Values
Totals
|
|||||||||||||


 This option allows you to exclude dates from the report. Click on the drop-down menu and select the dates you would like to exclude by selecting the checkbox next to the relevant date.
 Click and hold on the slider to resize columns
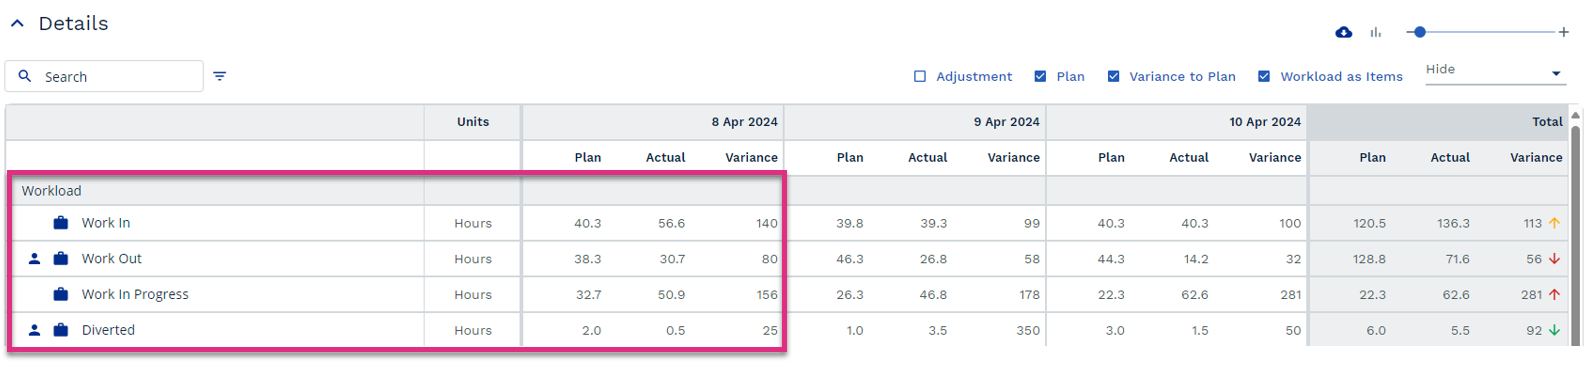
Work In
Work Out
Work In Progress
Diverted
Cost per Standard Hour
|
|
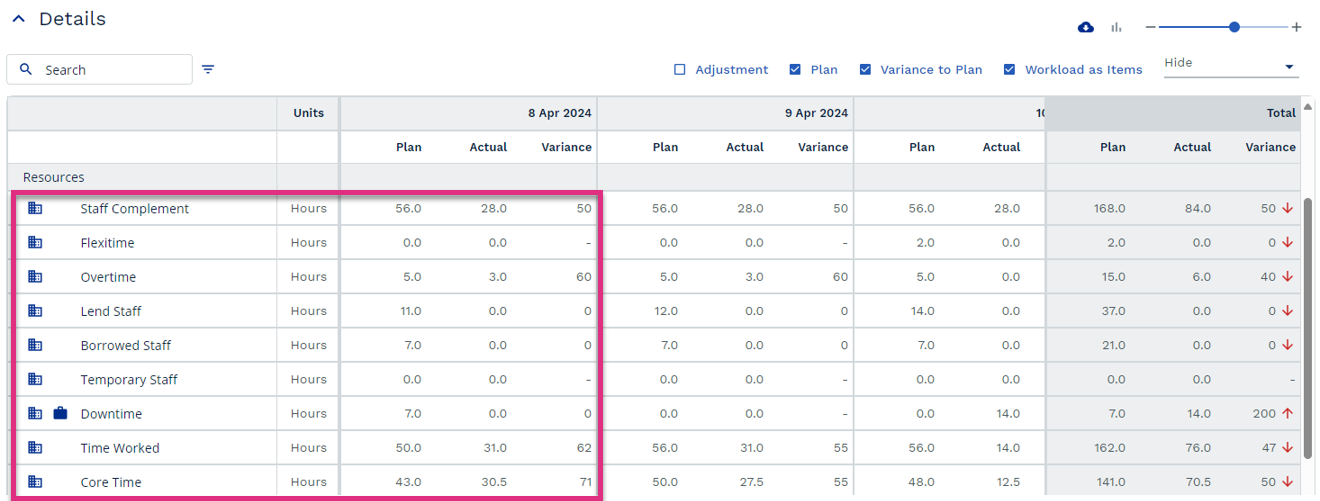
Staff Complement
Flexitime
Overtime
Lend Staff
Borrowed
Temporary Staff
Downtime
Time Worked
Core Time
|
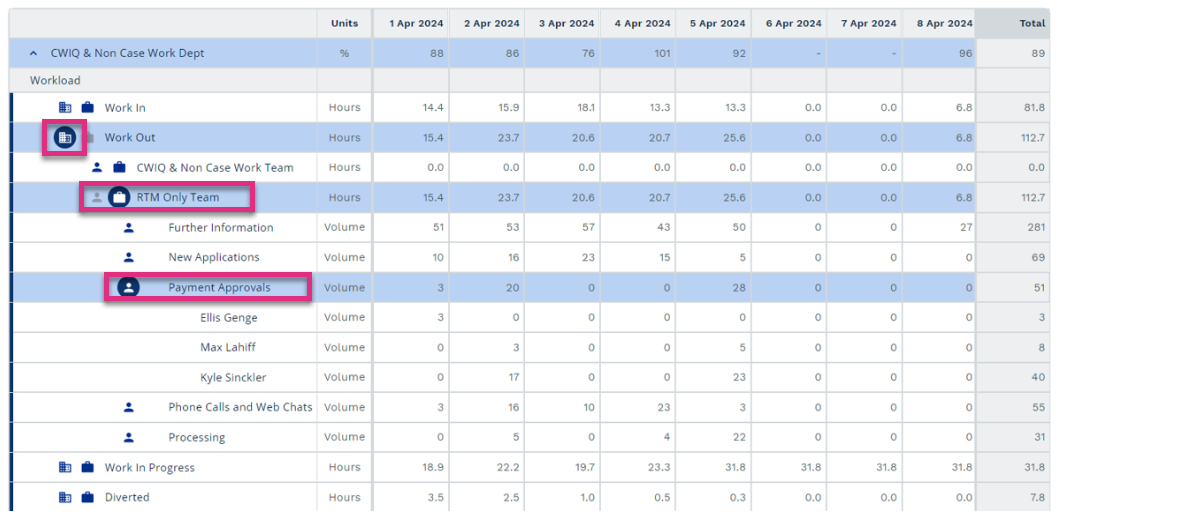
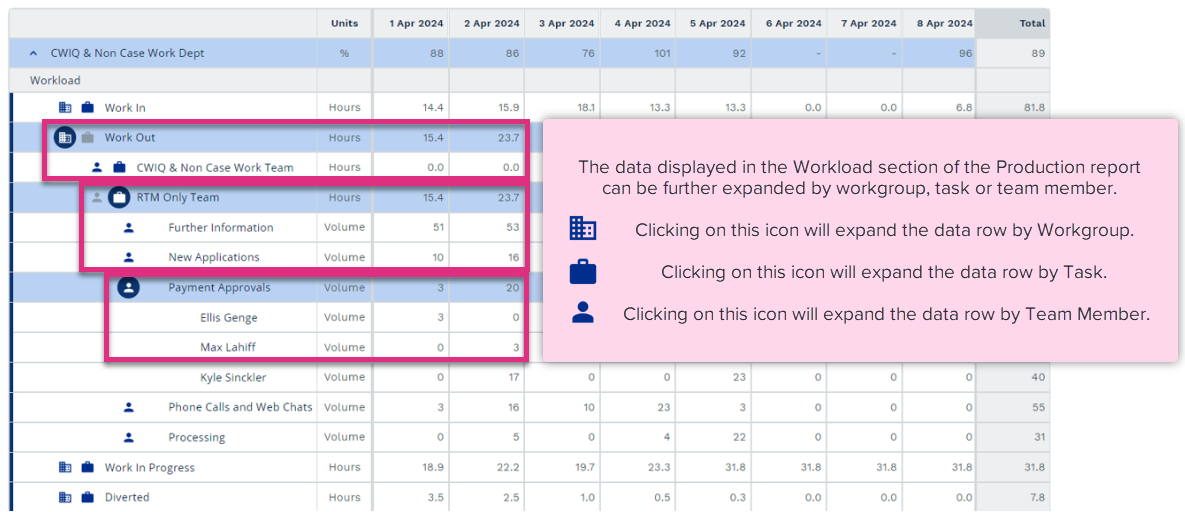
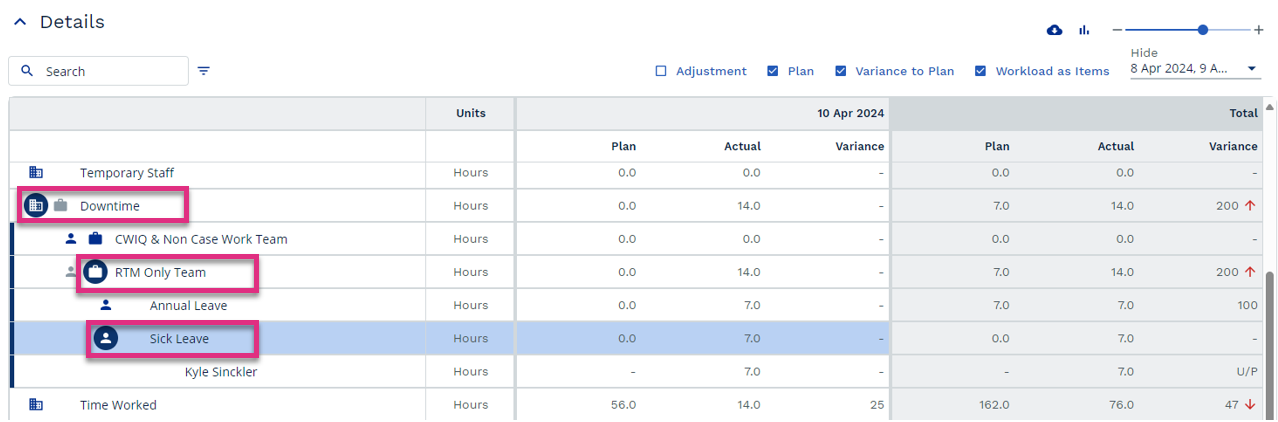
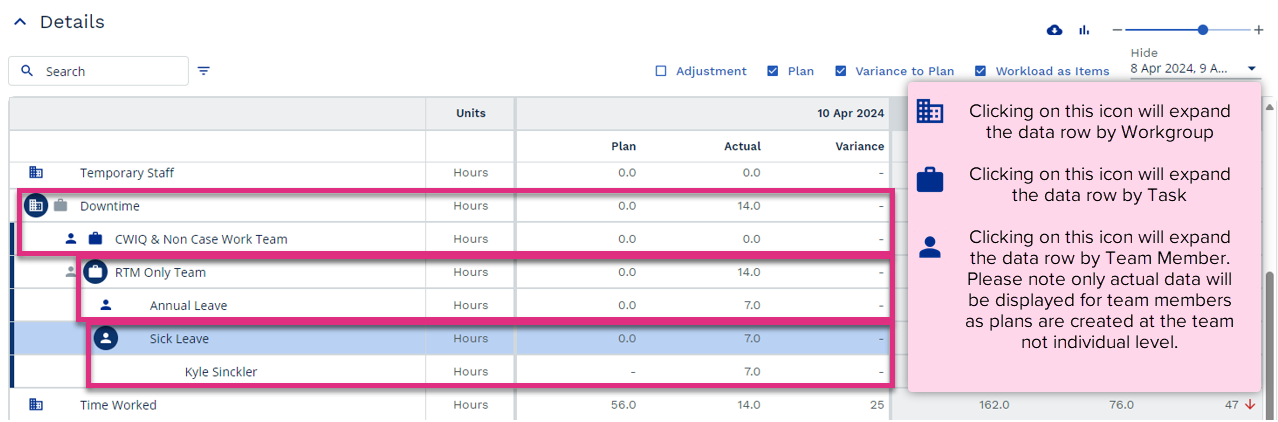
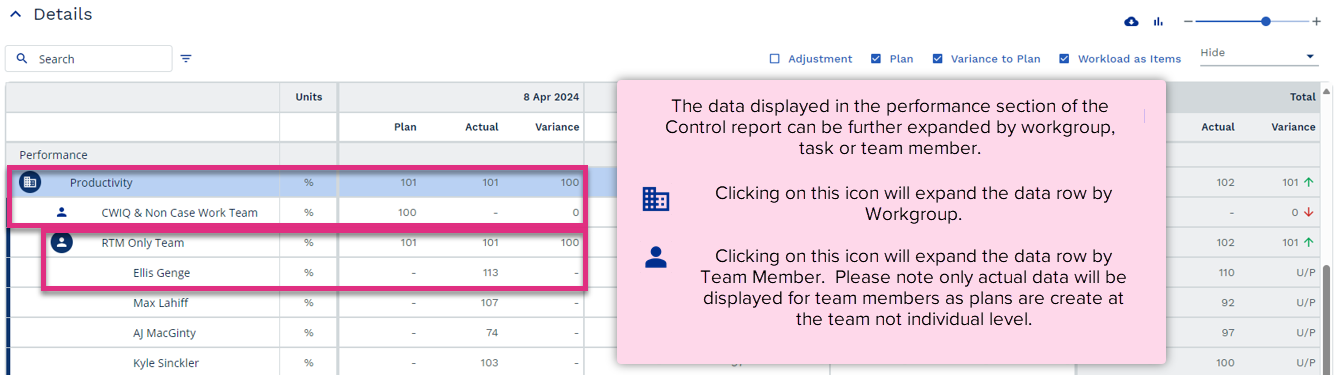
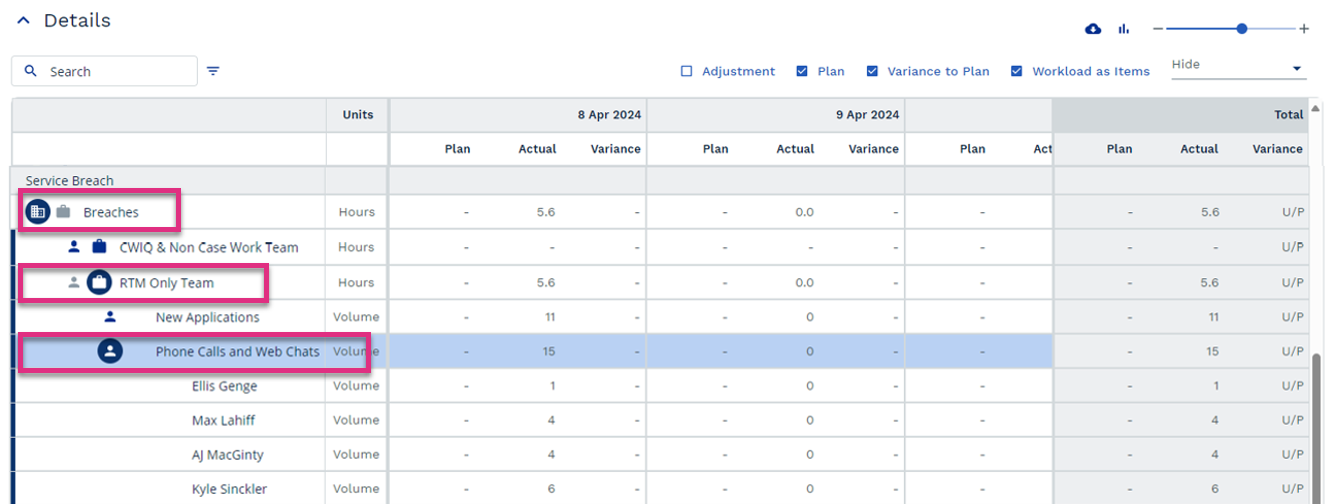
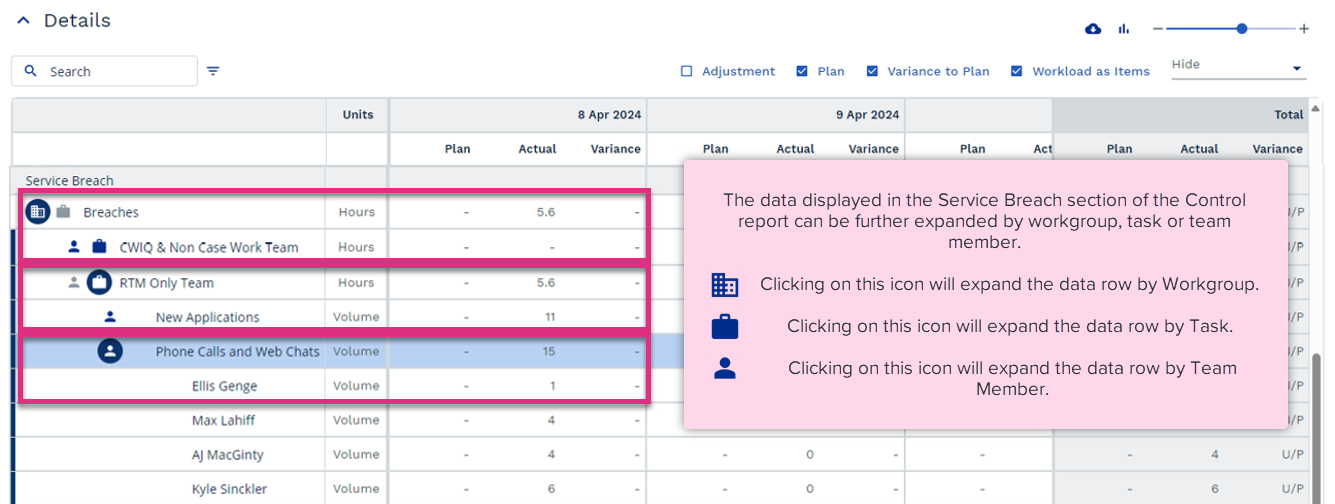
The data displayed in the Resources section of the Control report can be further expanded by workgroup, task or team member.
|
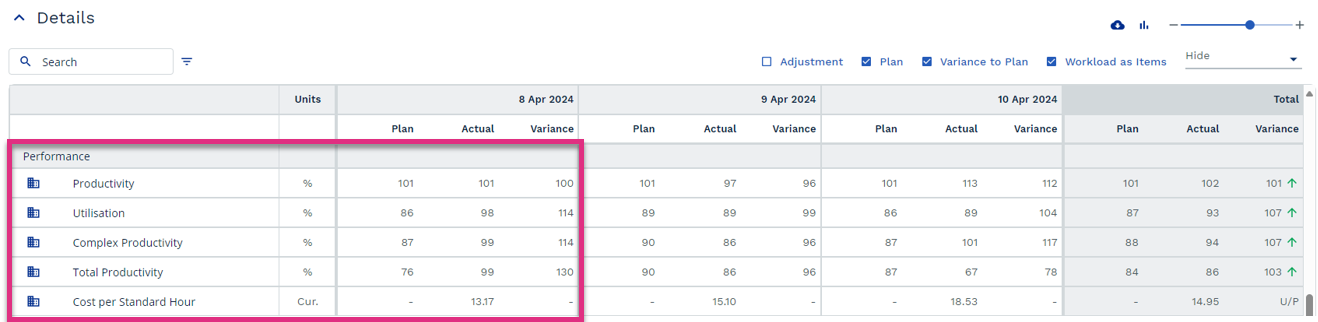
Productivity
Utilisation
Complex Productivity
Total Productivity
Cost per Standard Hour
|
|
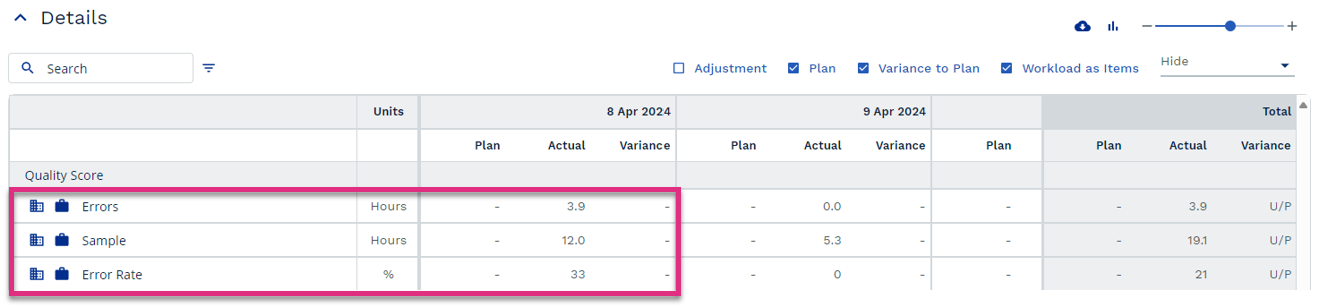
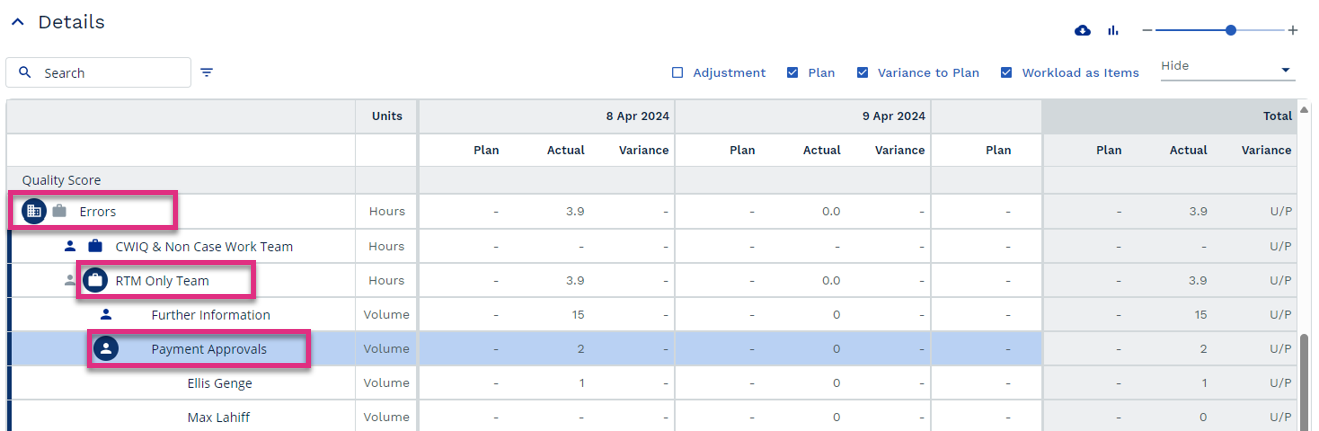
Errors
Sample
Error Rate
|
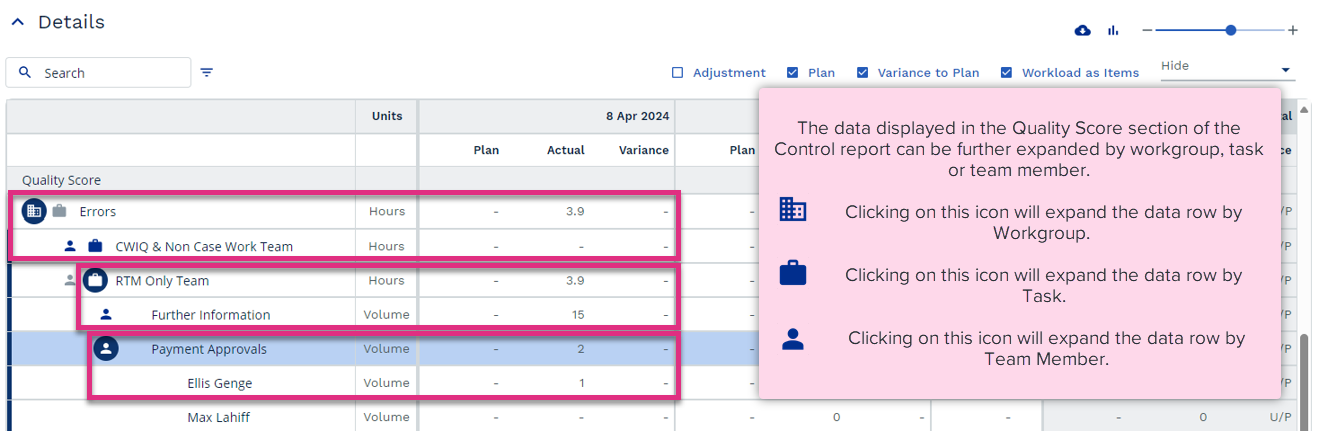
|
|
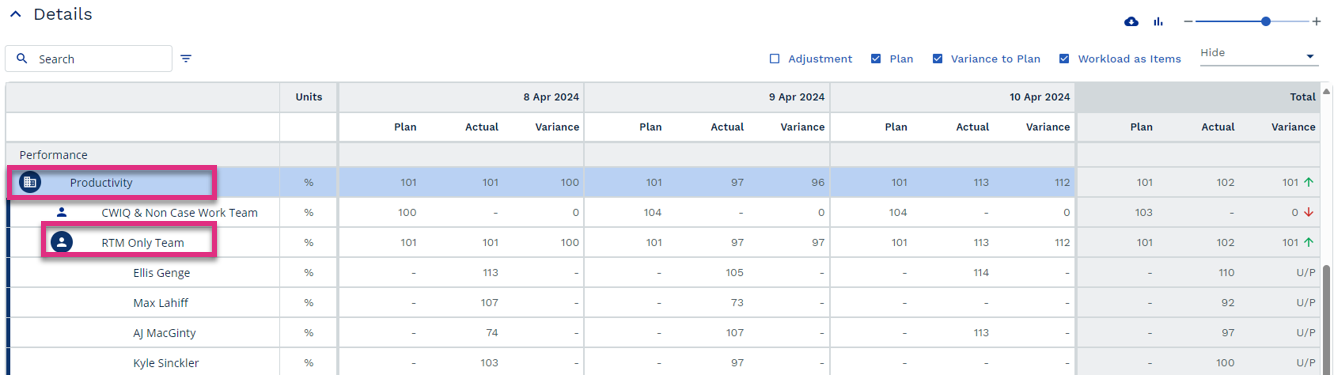
Please note that only actual values will be displayed here. |
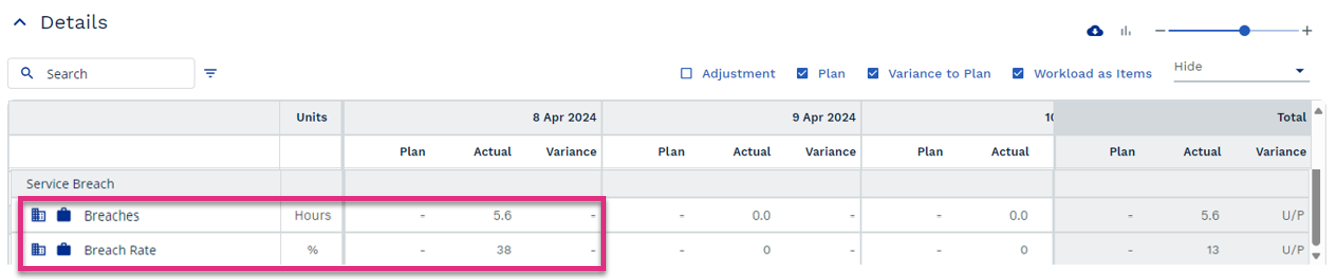
Breaches
Breach Rate
|
|
Headline Charts
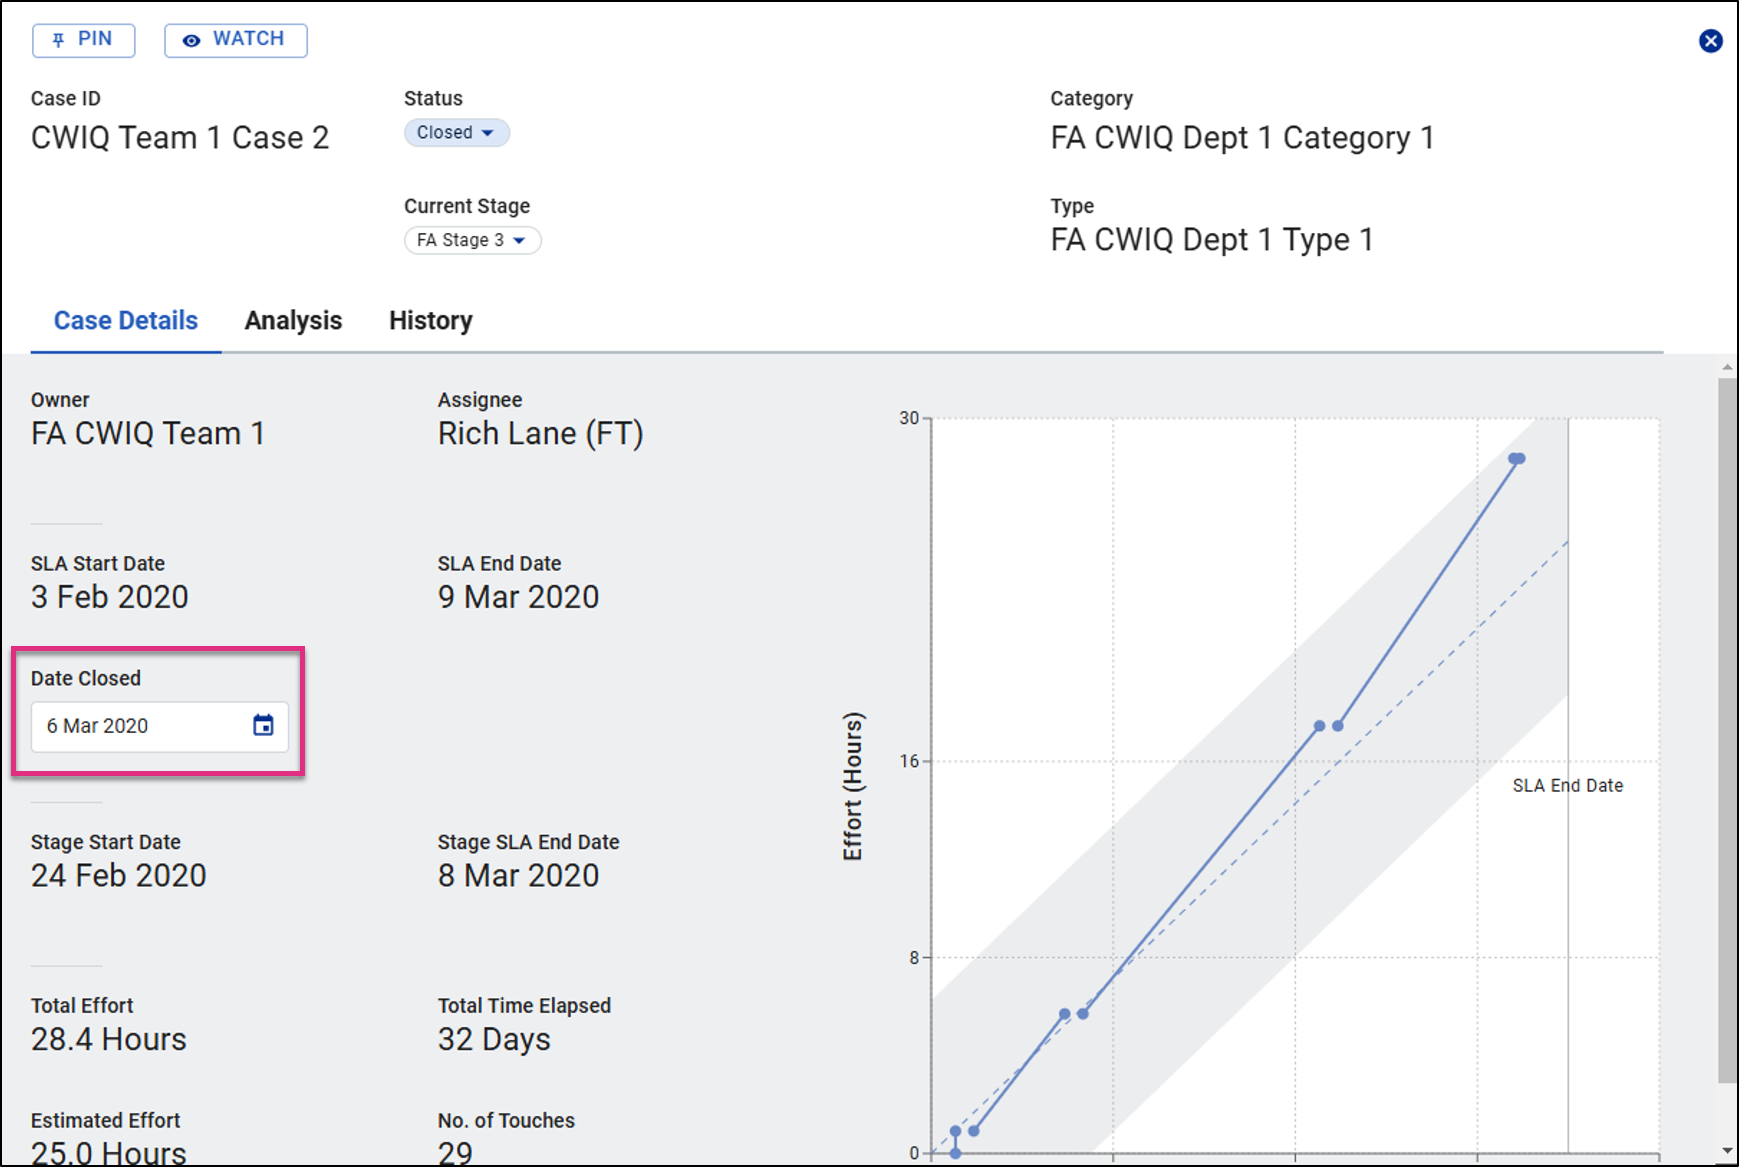
When reviewing the Control Report against a Case Plan the Work In Progress tile seen in the report for Task Plans will be replaced with a Cases Closed tile.
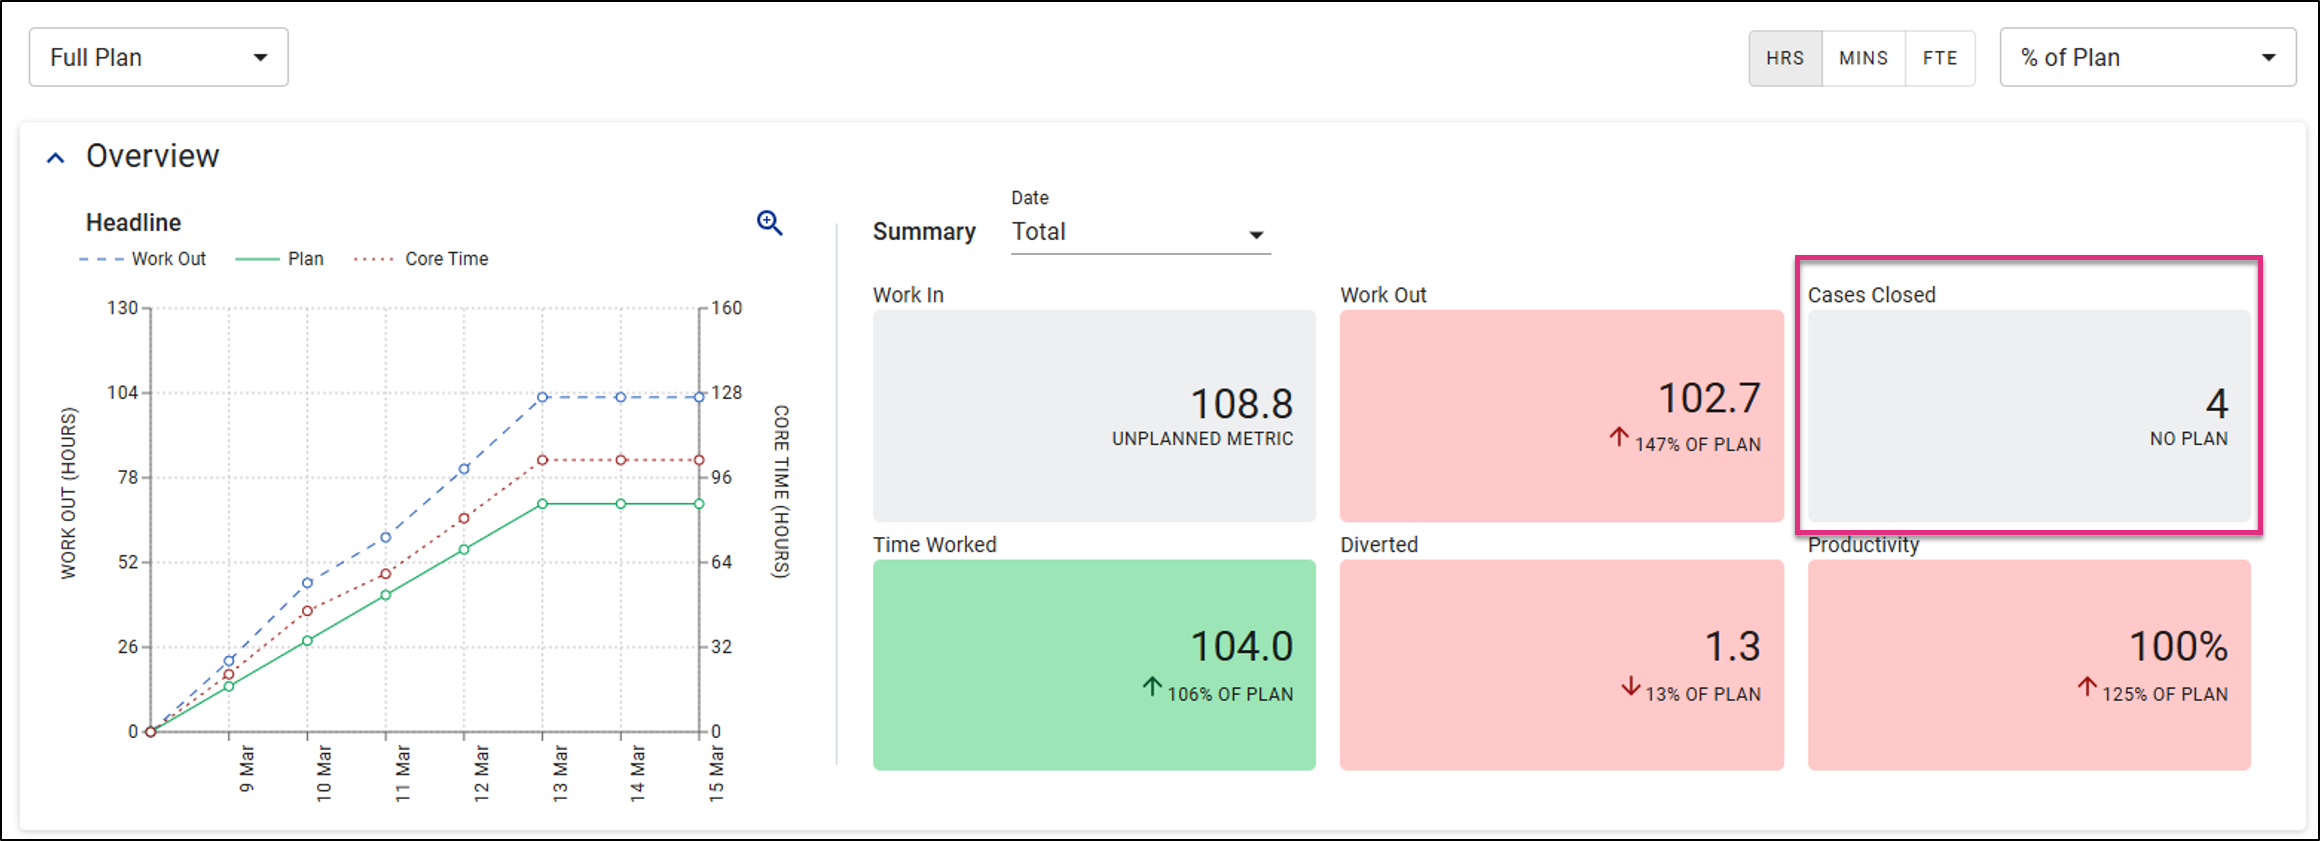
This will display the number of cases that have a closed date within the plan period.
The details section of the report will display:
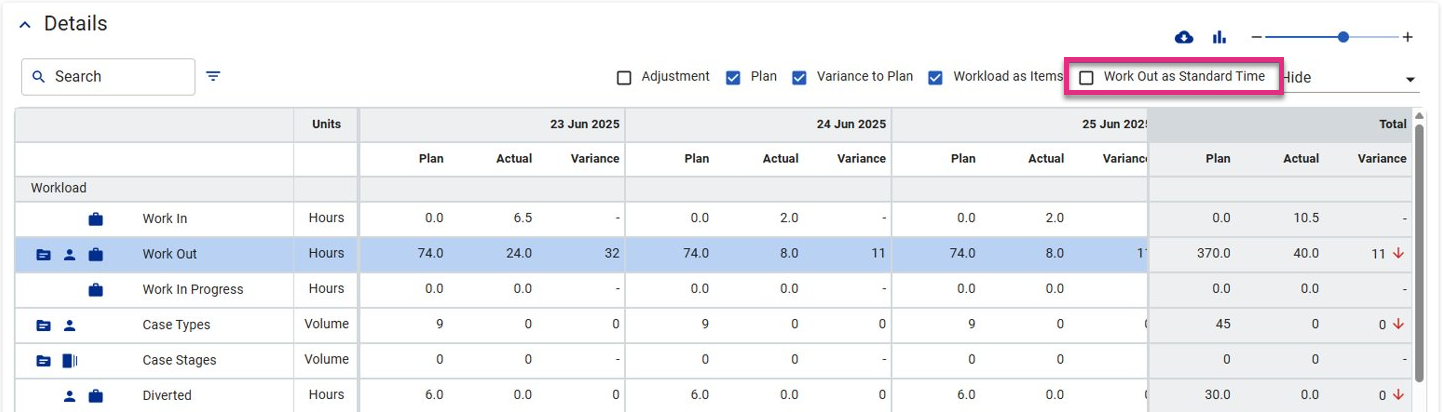
For plans built in items the plan value will be based on the Standard Time assigned to the planned Cases or Stages. The Actual value can be displayed based on the Core Tasks multiplied by their Standard Times or by the actual time logged in the Case Worklog.
You can change the displayed values for Actual Work Out using the Work Out as Standard Time check box.
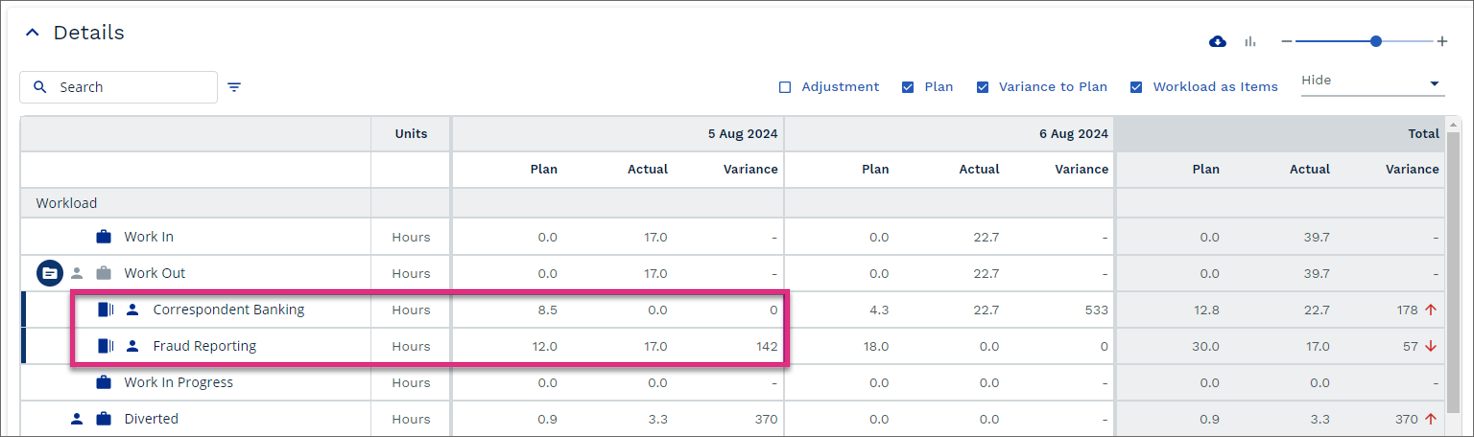
You can further expand the Work Out data to view the Planned and Actual values at a Case Type level by clicking on the  icon.
icon.
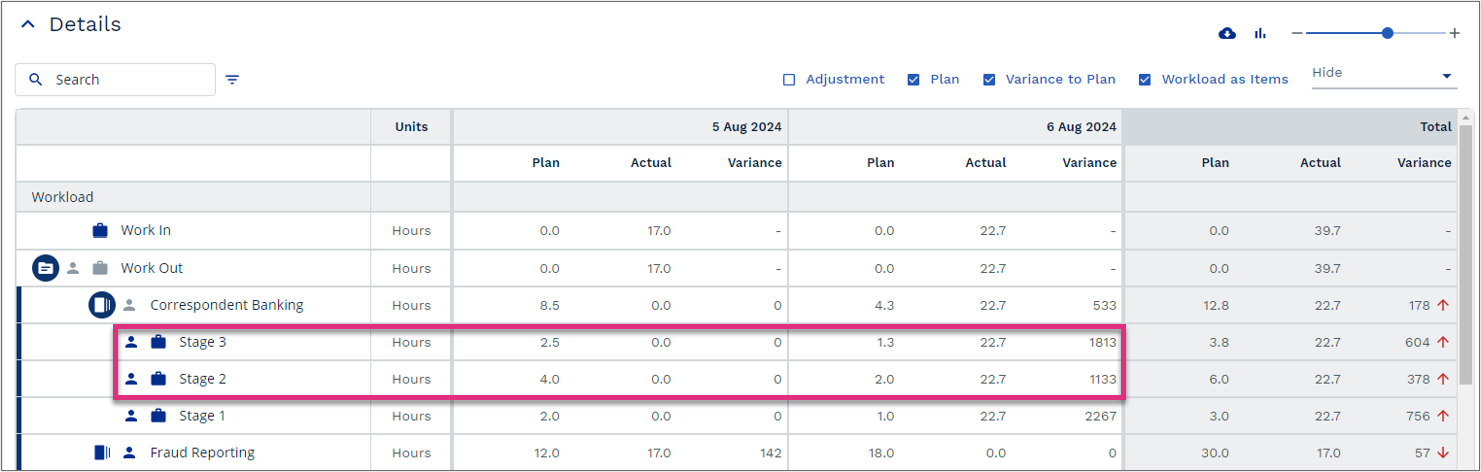
If the Case Types have Case Stages assigned to them, you will see an ![]() icon. This allows you to further expand the data for each Case Type by Case Stage.
icon. This allows you to further expand the data for each Case Type by Case Stage.
In addition to the Work Out row the Workload section will also display details for Case Type and Case Stages.
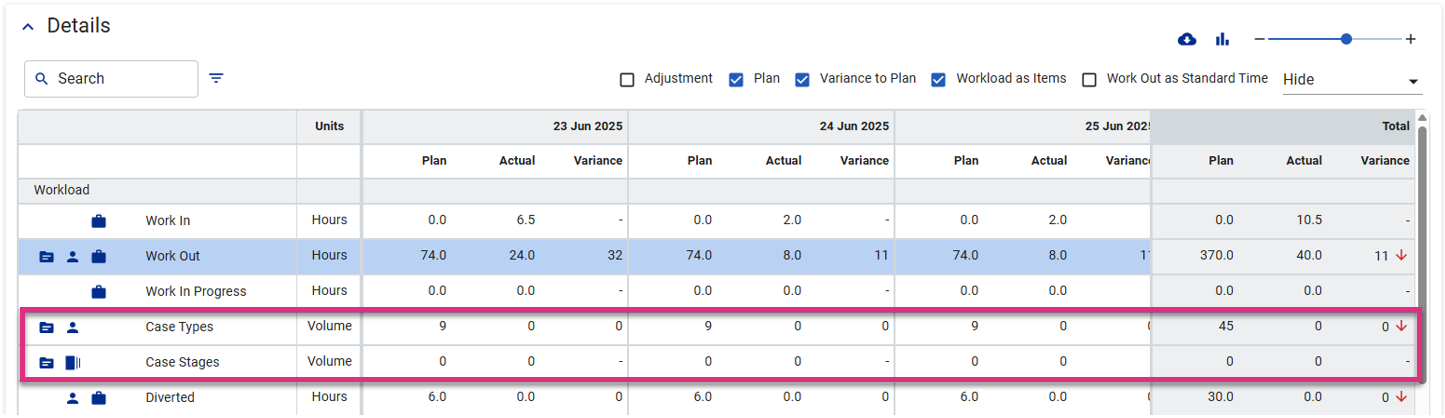
These rows will display any Plan values that you entered into your plan along with the Actual values captured against them.
The data displayed will depend on the report display options you have selected and the planning method you used, either hours or items.
| Plan built using 'Items' | Workload as Items
Not checked |
Workload as Items
Checked |
|---|---|---|
| Work Out as Standard Time
Not Checked |
Planned and Actual shown in Actual Time | Planned and Actual shown in Items |
| Work Out as Standard Time
Checked |
Planned and Actual shown based on Case Type and Stage Standard Times. | Planned and Actual shown in Items |
| Plan built using 'Hours' | Workload as Items
Not checked |
Workload as Items
Checked |
|---|---|---|
| Work Out as Standard Time
Not Checked |
Planned and Actual shown in Actual Time | Planned value will display a dash Actual shown in Items |
| Work Out as Standard Time
Checked |
Planned value will display a dash Actual shown based on Case Type and Stage Standard Times. If no Standard Time is defined, values will show 0.0 | Planned value will display a dash Actual shown in Items |
The Case Type and Case Stage can then be expanded further using the icons.
|
|
Expand by Case Type |
|
|
Expand by Case Stage |

|
Expand by Staff Member |
Case Type:
-
The Case Owner is set at a team level.
-
The Case Status is changed to Closed (If a case is re-opened after having its status changed to Closed the item will be removed from the Control Report Actual values. When the case is closed again the item will re-register with the new closure date.
-
If the case is closed by an account with data capture permissions enabled the item will be credited to that staff member in the team that owns the case.
-
If the case is closed by an account with no data capture permission enabled the item will be credited to the total count of the team that owns the case but will not appear when data is expanded by staff member. This means that the sum of the staff member values could be lower than the team overall value.
Case Stage:
-
The Case Stage is changed. An item is marked as complete for any Stage change, even if the case has previously been in the Stage it is changed to.
-
If the Case Stage is changed by an account with data capture permissions enabled the item will be credited to that staff member and the team they had selected in the hierarchy selector at the point the Stage was changed.
-
If the Case Stage is changed by an account with no data capture permission enabled the item will be credited to the team they had selected in the hierarchy selector at the point the Stage was changed. If a workgroup higher than team level is selected credit for closing the Stage will not register in any Control Reports.
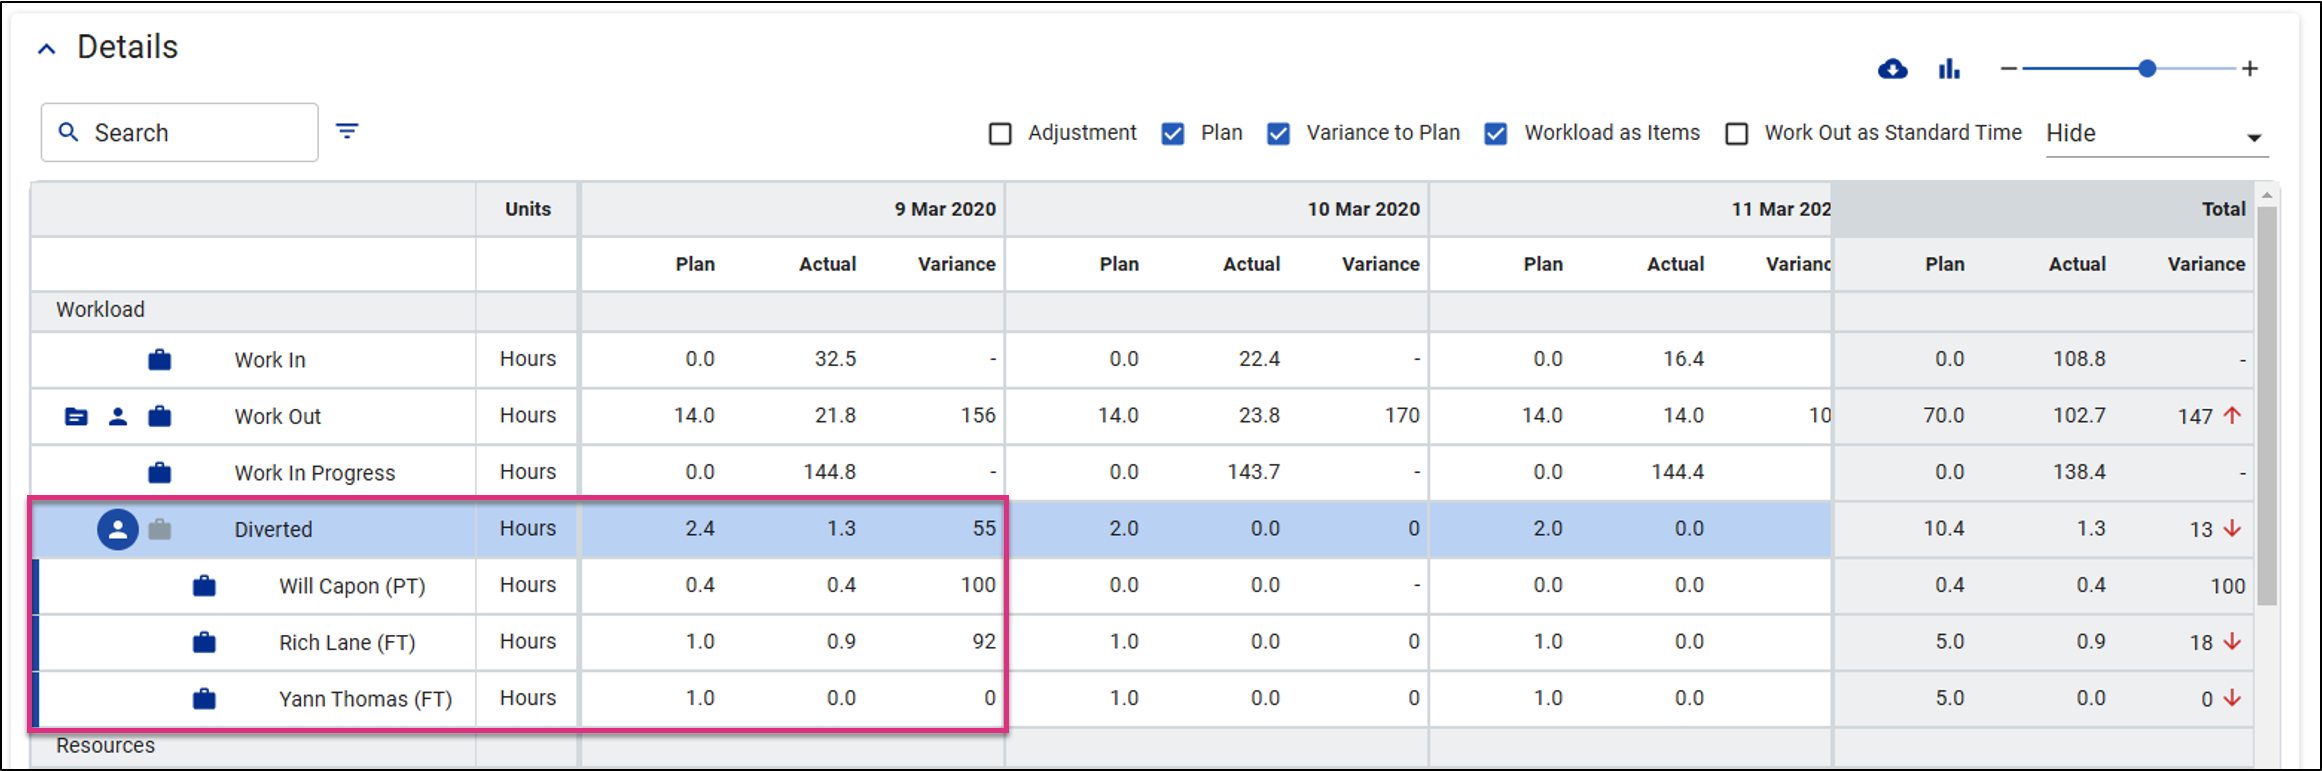
If the plan has been created using the individual staff member feature for planning resource and diverted time the plan and actual values will be displayed when expanding these sections allowing for a more detailed view of what was planned and what actually happened.
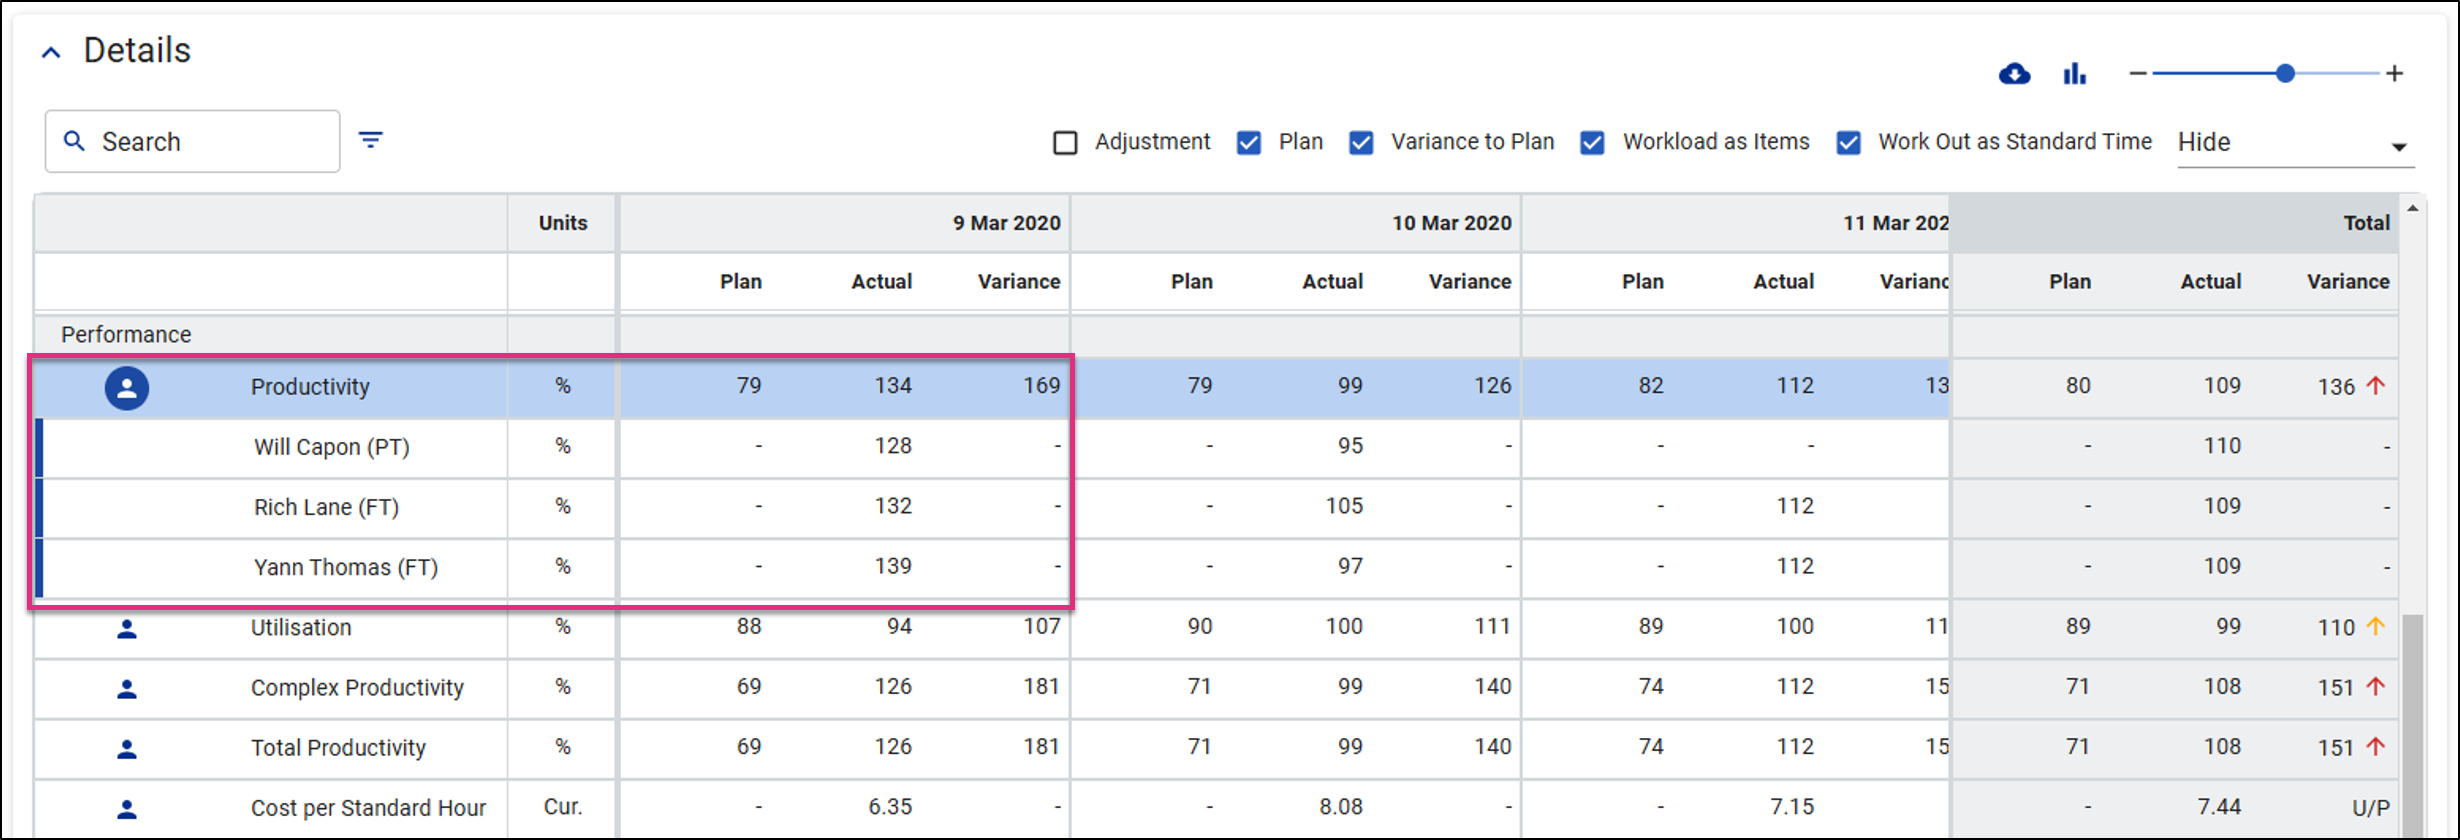
Productivity will display the actual values based on the Work Out as Standard Time option selected. If the check box is selected the productivity value displayed will be based on the items or core tasks completed multiplied by the standard times.
| For more information on... | |
|---|---|
| Control Report Video | |
| Video Library |
See Video Library |
|
Calculations |
See Key Equations |
| Frequently Asked Questions | See FAQs |
| Notes | See Notes |


