Fly by Five Dashboard
Overview
The Fly by Five Dashboard helps Leaders to monitor and drive Team and Departmental performance against target.
Gain a quick overview of the five crucial KPIs (Key Performance Indicators) for your Teams and Departments with colour coded data. Use this key information to inform Leaders and put them in a better position to make vital changes.
![]()
|

|
The Fly by Five Dashboard will show you five cards containing key data metrics;
-
Productivity or Productivity Improvement
-
Utilisation
-
Latent Capacity
-
Rigour Score
-
Downtime
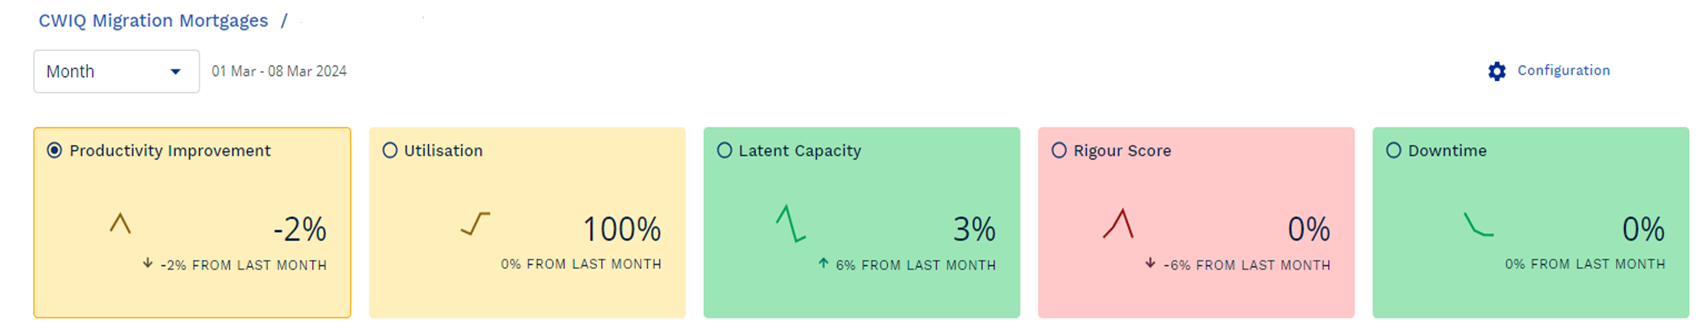
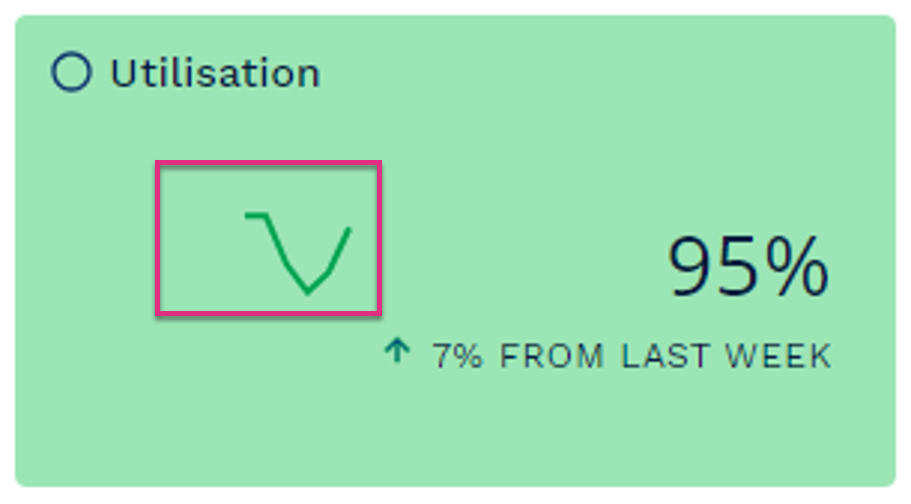
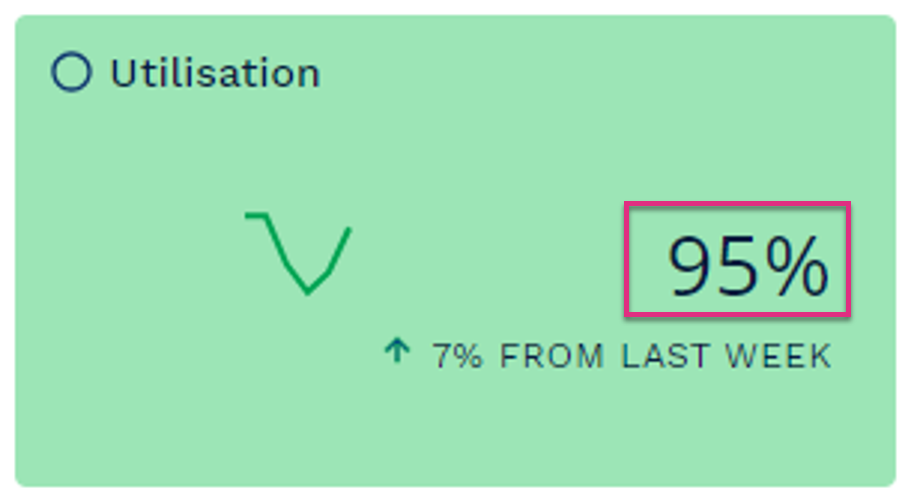
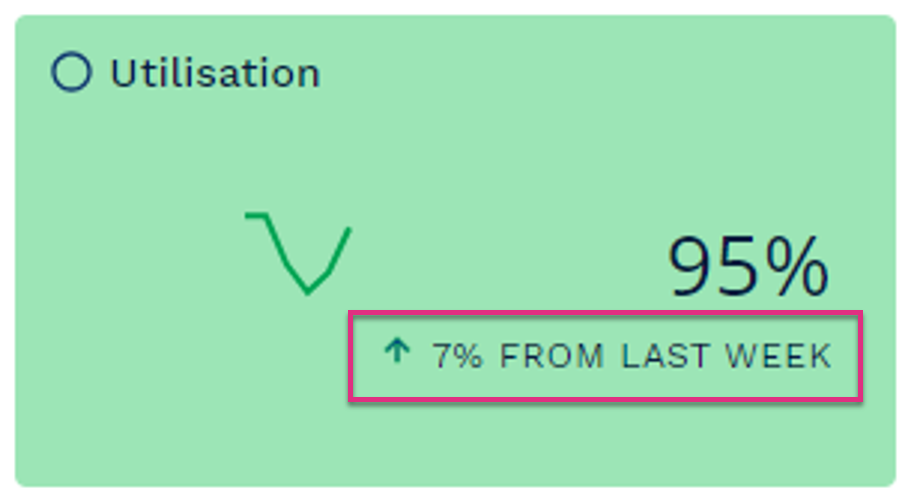
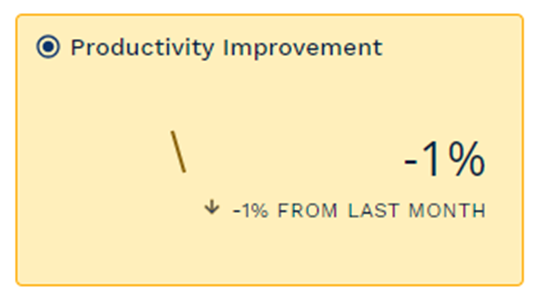
Each metric card will show you three things:
|
The five key metrics at the top of the Dashboard will show you the total average across all Teams within the workgroup.
Department and Team averages will be shown below in the Workgroup Details table.
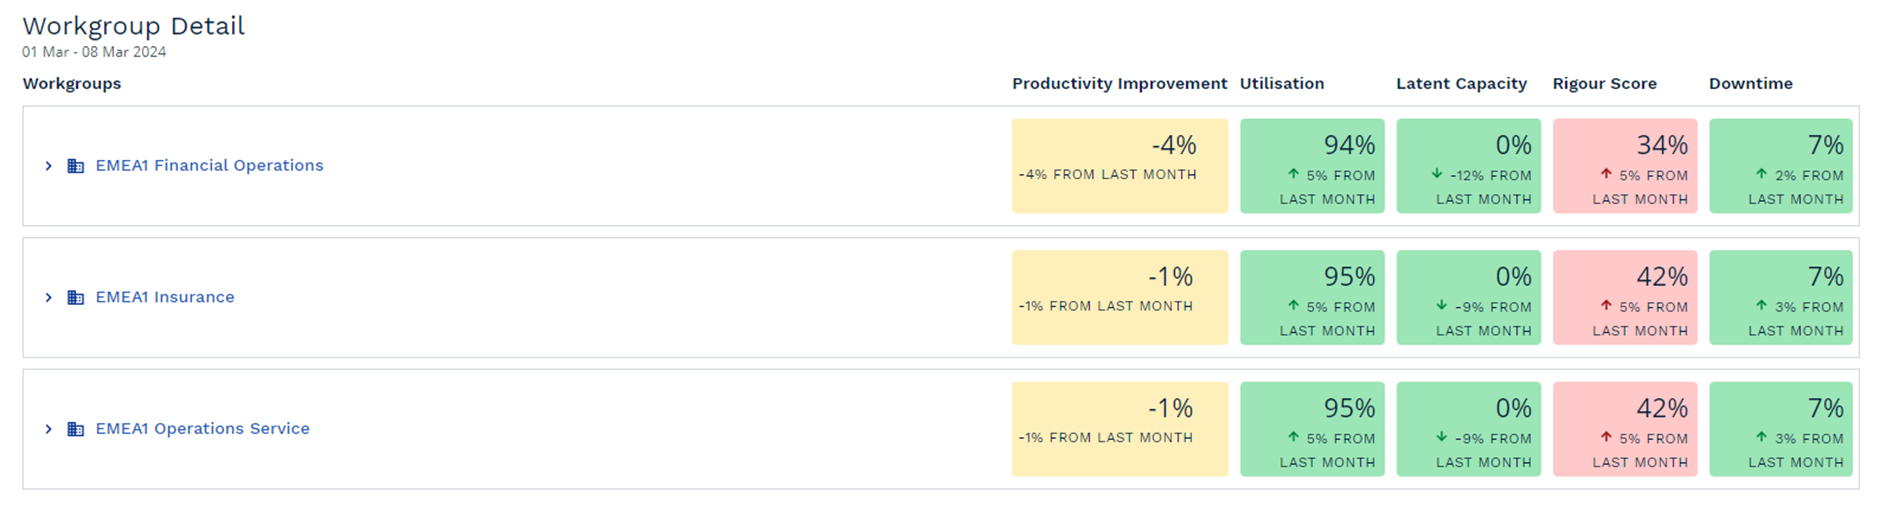
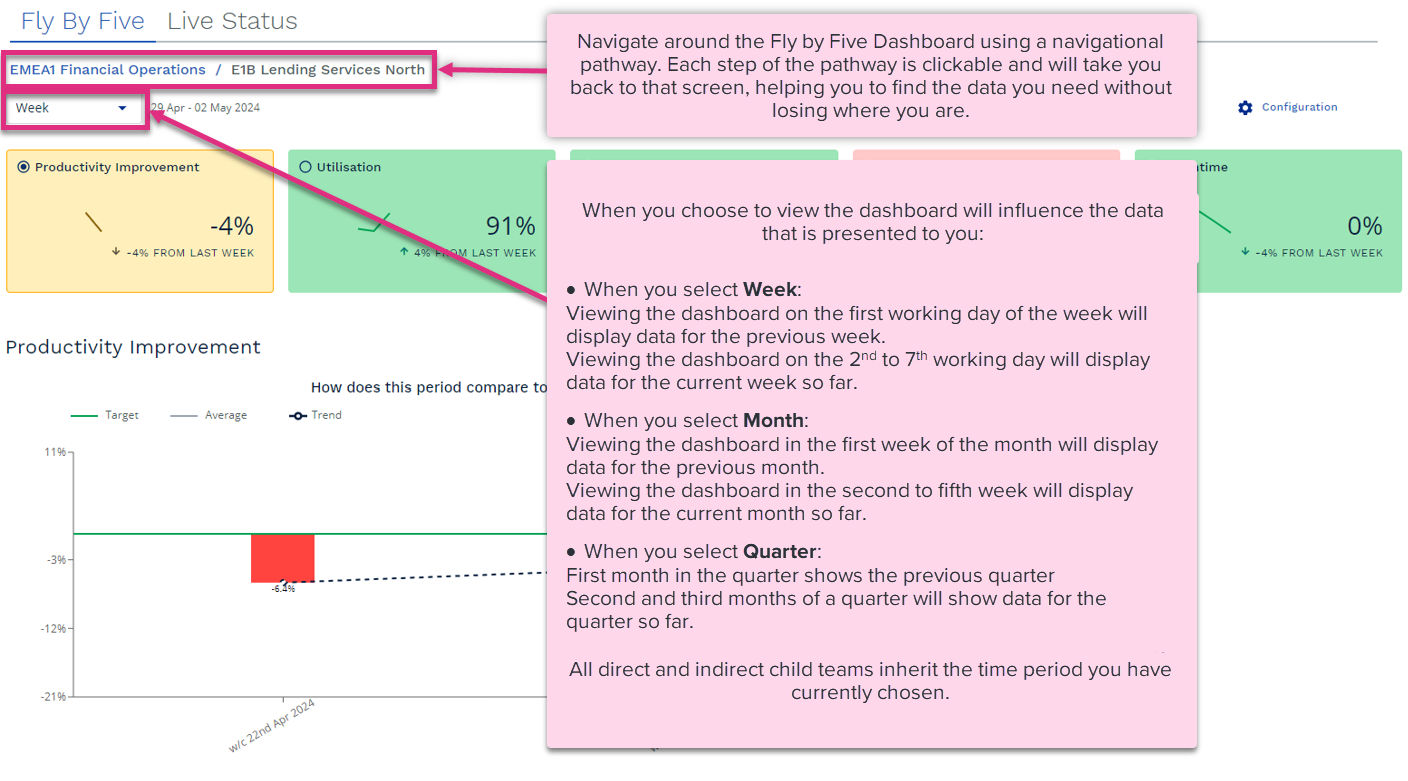
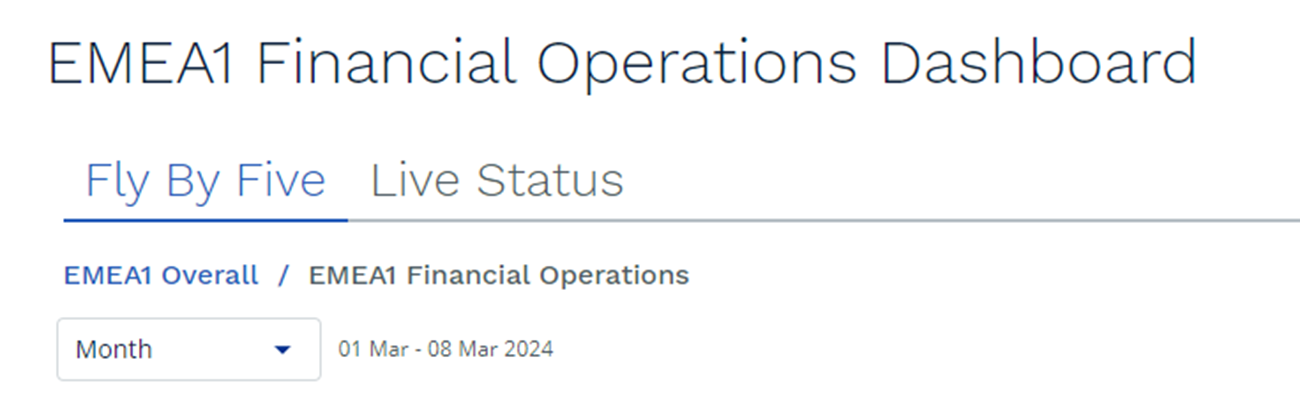
To make sure you know what data you are seeing, the dates for the current period displayed are shown at the top of the dashboard. The selected time-period will remain the same no matter how far into the hierarchy you drill-down.
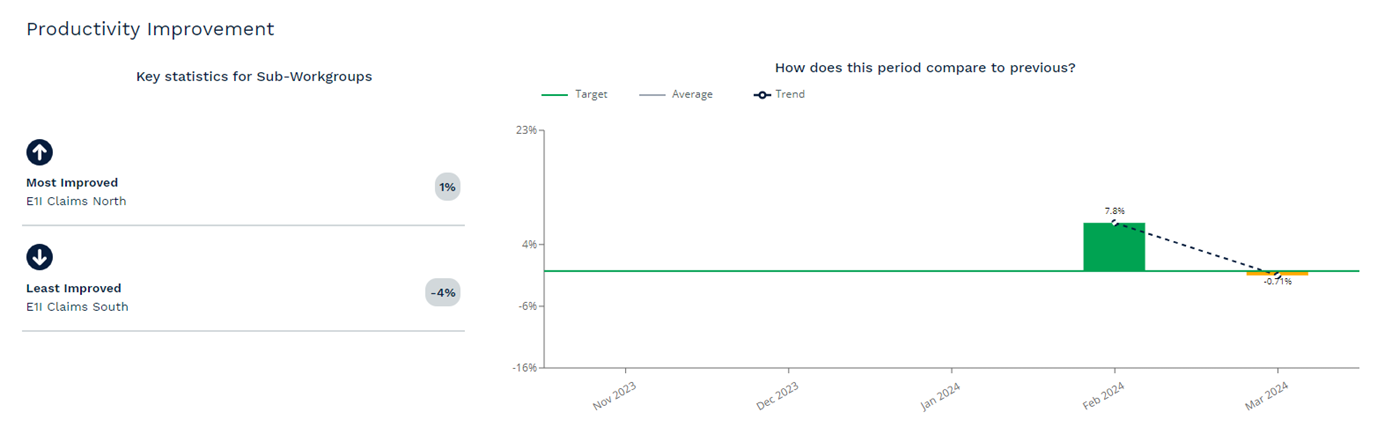
Configuring your Fly by Five Dashboard to display Trend Data will display additional information via the metric card. This will provide insights such as Most Improved and Least Improved Teams and highest, lowest and average percentages against historical data for the selected KPI.
Once enabled you can view the metrics for each KPI by selecting their radio button.
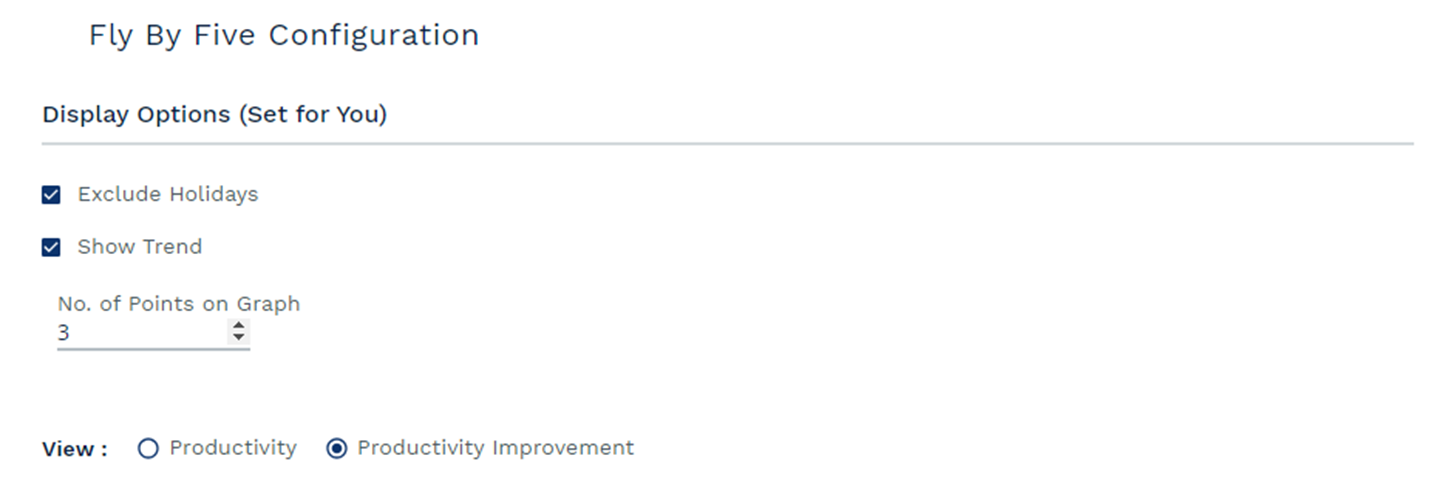
Exclude Holiday – Selecting the Exclude Holidays option will remove Downtime related to National Holidays from the Downtime KPI data.
Show Trend – Selecting the Show Trend option will apply additional trend data to your KPI’s.
No. of Points on Graph – Dictates how much historical data is displayed when Show Trend is enabled. This can between 3 and 6 periods
View: - Allows you to view Workgroup productivity as the actual productivity achieved or as a % change from the last period.
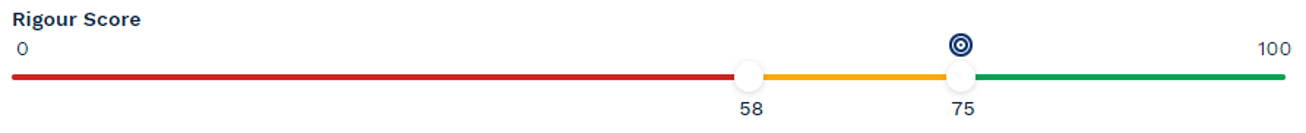
Leaders can adjust and configure the RAG (Red, Amber and Green) values and set relevant workgroup targets.
These targets are applied to the Workgroup they are set at and any child workgroups but only when the Dashboard is viewed at that level of the hierarchy by the user who set the targets.
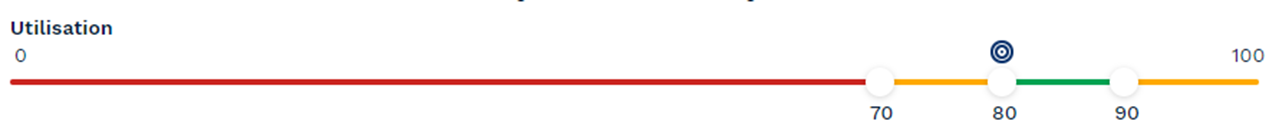
To do this, select and drag the sliders to the required levels.
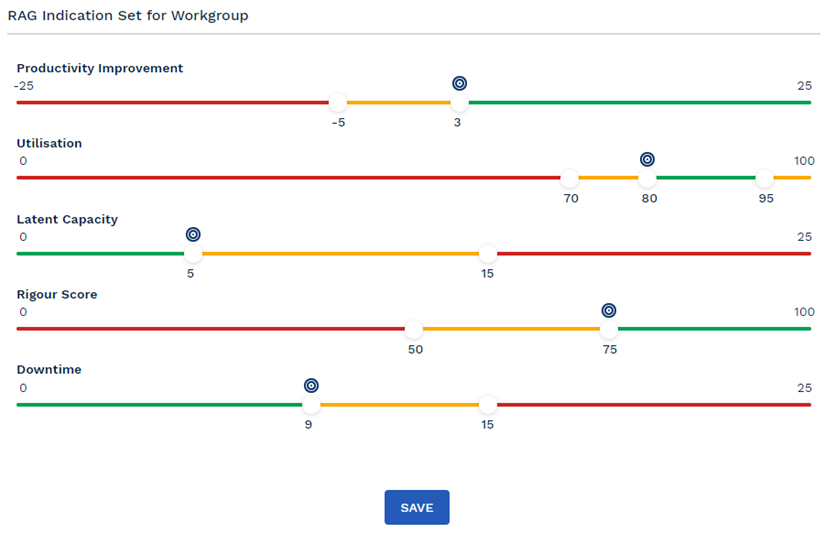
Productivity Improvement
Utilisation
Latent Capacity
Rigour Score
Downtime
|


| For more information on... | |
|---|---|
| Dashboard Videos | Live Status Dashboard Video |
| Fly by Five Dashboard Video | |
| Casework Dashboard Video | |
| Executive Insights Video | |
|
Calculations |
See Key Equations |
| Frequently Asked Questions | See FAQs |
| Notes | See Notes |
| Video Library | Video Library |


